Index Opportunity - Facility 3M™
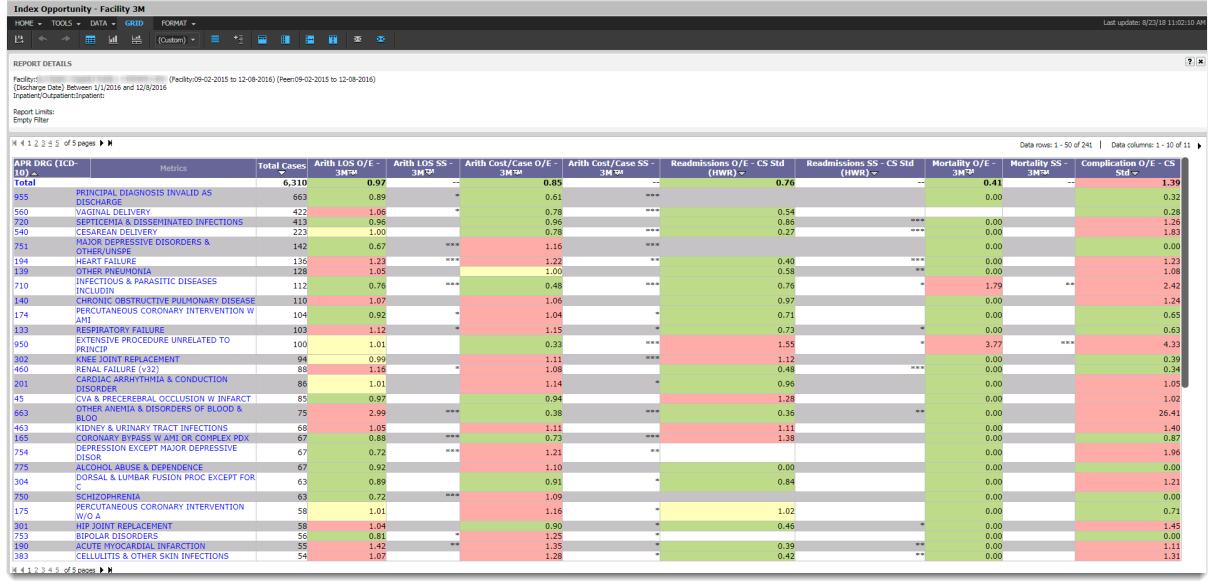
This analysis is designed to help you quickly identify areas of opportunity for both diagnosis and outcome. The report uses color coding to show you at-a-glance how each specific diagnosis at a facility is performing per outcome.
The analysis includes one row for each APR DRG that has a case volume greater than zero. It also has columns for the following outcomes: LOS, Cost per Case, Readmissions, Mortality, and Complications. Also included are columns for Observed/Expected and Statistical Significance.
- O/E results less than .98 indicate the APR DRG is performing better than expected, and are colored green
- O/E results between .98 and 1.02 are within range, and are colored yellow
- O/E results greater than 1.02 indicate the APR DRG is performing worse than expected, and are colored red
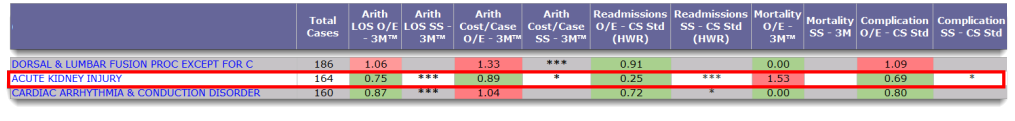
For example, the diagnosis for "Acute Kidney Injury" may be performing well in each outcome category except for Mortality. On the Index Opportunity report, the row for the Acute Kidney Injury diagnosis would be colored mostly green across the outcomes, but then colored red in the Mortality column. You can quickly see that the facility shows an area for improvement in mortality for acute kidney injuries.
Report Sample
|
Note: The analysis is preset to return APR DRGs for this methodology so the Setup Analysis Tab has been removed. There are 3 required prompts that you must select before running this analysis. Required Prompts:
Optional Prompts:
|
Default Metrics
The following metrics appear in the grid when the analysis returns:
Total Cases (Results are sorted by volume, from high to low.)
-
Arith LOS O/E - 3M™
-
Arith LOS SS - 3M™
-
Arith Cost/Case O/E - 3M™
-
Arith Cost/Case SS - 3M™
-
Readmissions O/E - CS Std (HWR 2024)
-
Readmissions O/E - SS Std (HWR 2024)
-
Readmissions O/E - CS Std (HWR 2023)
-
Readmissions O/E - SS Std (HWR 2023)
-
Mortality O/E - 3M™
-
Mortality SS - 3M™
-
Complication O/E - CS Std
-
Complication SS - CS Std
Analysis Sample