Exporting Grid Analyses to Excel
When you click Export on grid analyses, a window of Export Options opens. The export limit for Excel is 500,000 cells.
The following table describes the available options:
| Export Option | Description |
|---|---|
|
Export |
Whole Analysis: Exports the entire analysis, including all the pages. Portion displayed only: Exports only the page on the screen when Export to Excel is clicked. |
|
Excel with plain text |
Exports the analysis as plain text. The content is displayed using the default settings in Excel, which means that the structure and format from the browser window are lost. For large analysis results, this export option is recommended over Excel with formatting. |
|
Excel with formatting |
Exports the analysis with the same formatting, color, and structure that appears in the browser window. Excel does not support all colors that browsers do, so some colors may differ after export. If your analysis is large, it is recommended that you use the Excel with plain text export option. |
|
CSV file format |
Exports the analysis into a comma-separated values (CSV) format as plain text. This format is suitable for Microsoft Access and Lotus 1-2-3. The structure and format of the analysis, as it is displayed in the browser window, is not retained. |
|
HTML |
Exports the analysis to an HTML page. The structure and format of the analysis, as it is displayed in the browser window, is retained. |
|
Plain text |
Exports the analysis to a plain text page. The structure and format of the analysis, as it is displayed in the browser window, is not retained. Choose one of the available Delimiters for separating fields of text: comma, tab, semicolon, space, or tilde. |
|
Export Analysis Title |
Exports the title of the analysis, which appears at the top of the spreadsheet. |
|
Export Filter Details |
Exports the details from the View Filter. These details appear above the grid in the spreadsheet. |
|
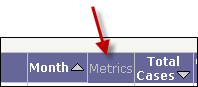
Remove extra column |
Controls the extra "Metrics" column that appears in grids in the browser window:
Yes: Includes the Metrics column in the spreadsheet. No: Removes the Metrics column from the spreadsheet. Automatic: Includes the Metrics column in the spreadsheet.(Default) |
|
Export metric values as text |
Reformats metric values from numeric to text format. |
|
Export headers as text |
Reformats row and column headers to text format |
|
Embed Images |
Exports images as stand-alone images in Excel. (This option is available only when Excel with formatting is selected.) |
|
Do not prompt me again |
Saves the current selections as the default for exporting to Excel. The next time you click Export, the current selections apply to the exported spreadsheet automatically and the Export Options do not appear. If you want the Export Options window to appear the next time you export to Excel, go to Admin > Report Preferences. On the window that appears, click Export Reports > Show options when exporting > Apply. On the Export Reports window, you can also make desired changes to the default export settings. |
|
Export |
Click this button to export the analysis. You may receive none or one or both of the following messages:
The Download File window appears. Click Open to open the spreadsheet in a new browser window or Save to save it to your hard drive. |