Smart Peer Builder
The Smart Peer Builder allows you to research key characteristics of peer facilities so that you can create a customized peer group you can select from the Peer prompt when running an analysis in QualityAdvisor. The Smart Peer Builder helps you to find and select those peer facilities that are most similar to your own facility.
Overview
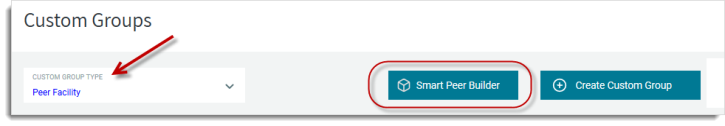
- Begin by going to the Custom Groups section of QualityAdvisor

- Expand the Custom Group Type menu and select the Peer Facility attribute type. When this attribute type is selected, the Smart Peer Builder button appears next to the Create Custom Group button
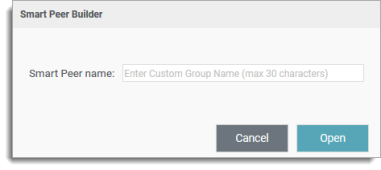
- Click on the Smart Peer Builder button and enter a name for the peer group you are creating. Then click the Open button.
Note: The name you create here is the name that will display both on the main Custom Group screen, and in the Peer prompt under User Defined Groups when creating an analysis
- Use the features of the Smart Peer Builder (described below) to make peer facility selections. There is no limit to the number of facilities you can select, but be aware that the peer group must be in compliance with the External Peer Methodology before you can save the final group. When you have completed all of your selections, click on the Save button at the top of the Smart Peer Builder screen. Once the group is saved, it is added to the main Custom Group page as well as to the Peer prompt under User Defined Groups
Note: Once created, you can interact with a Smart Peer group the same way you can interact with any other Custom Group, including; Deleting, Editing, Sharing, and Duplicating
Similarity Scoring
Patent Pending — Premier's Smart Peer Methodology September 2020
When selecting peer facilities, it is best to select facilities that are most similar to your own. To determine similarity, the Smart Peer Builder uses two similarity scoring types: The Euclidean distance (Raw) score, and the Normalized similarity score based on a scale from 1-10.
Euclidean Distance:
- The underlying method used to produce the similarity score is K-Nearest-Neighbors (k-NN); an algorithm that evaluates the proximity between two data points (i.e., a facility and its peer) on a coordinate plane. (Please see Smart Peer Builder Similarity Score Methodology in the QualityAdvisor Methodologies Guide for more detailed information)
- The resulting distance (or score) is referred to as Euclidean distance, where a small value indicates greater similarity across the three data domains
Normalized Similarity Score:
Given the relative complexity of the Euclidean distance (Raw) score algorithm, the Smart Peer Builder also includes a "normalized" score for ease of use. These values are based on the Euclidean distance but are "normalized" into deciles so that similarity can be measured on a scale from 1 to 10, where a score of 10 is the most similar.
Four Similarity Scores are included:
- Overall Similarity (1-10)
- Patient Mix Similarity Score (1-10)
- Geographic Similarity Score (1-10)
- Structural Similarity Score (1-10)
Both the Euclidean distance and Normalized similarity scores are evaluated across the top 200 closest facilities to determine an Overall Similarity score, based on the weighted average of the three domains for Patient Mix, Geographic Similarity, and Structural Similarity.
|
The Patient Mix domain includes clinical factors: |
||
|
|
|
|
The Geographic domain includes: |
|
|
The Structural domain includes: |
|
|
|
Important Reminder: When viewing similarity scores keep in mind the opposing difference between the Euclidean distance score and the Normalized scores. Facilities that are most similar will have both a LOW Euclidean distance (where lower is better), and a HIGH Normalized score (where higher is better).
Note: The Smart Peer Builder displays columns for all four Normalized scores by default. You have the option to add the column for the Euclidean distance to the main grid from the Column Settings tab. When viewing the 3D Chart, only Euclidean distance values are shown (for a subset of 50 most similar hospitals). These values can be viewed by hovering over a plotted facility on the chart.
Using the Smart Peer Builder
When the Smart Peer Builder screen first opens, you will see the top 200 comparatively published Premier peer facilities that are the most similar to your facility based on the default weight settings for each domain described above. As you change the weightings for the domains using the slider features at the top of the screen, the peer facility list in the grid automatically updates to show the facilities that are now most similar based on the new weight settings. Note: All facilities on the list are compliant with the External Peer Methodology.
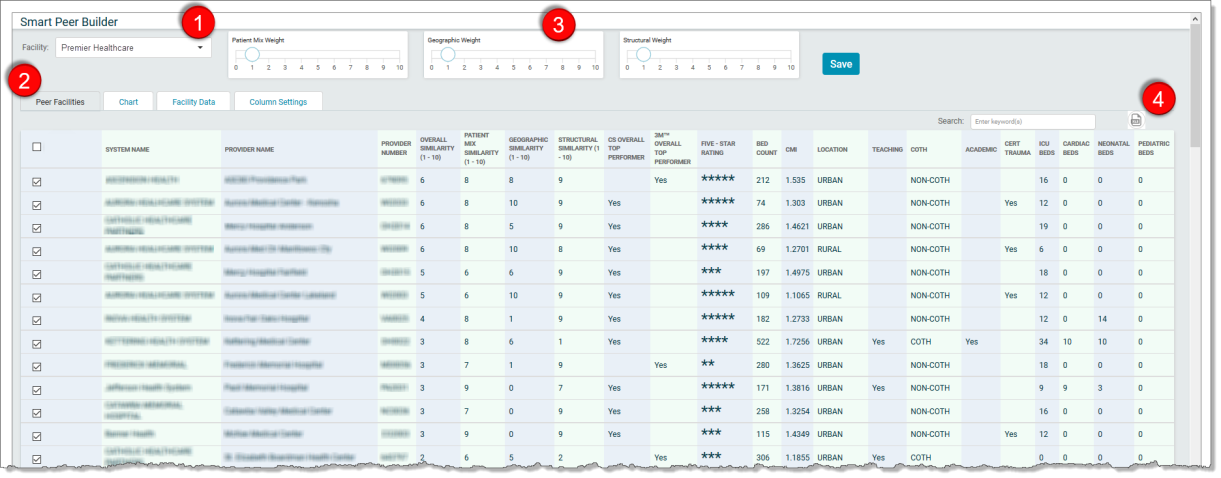
1. The Facility Filter
The Facility Filter is a drop down menu which includes all of the facilities that you have access to.
Each time you select a facility from this menu, the screen refreshes to show the Premier peer facilities that are the most similar to the newly selected facility.
Note: The Facility Data tab (described in #2 below) displays the relevant data for whichever facility is selected from this drop down menu.
2. The Peer Facilities, Chart, Facility Data, and Column Settings Tabs
- The Peer Facilities tab is the main screen of the Smart Peer Builder. The Peer Facilities (grid) sorts the peer facilities with the lowest Euclidean distance score first and then the highest Overall Similarity (Normalized) score at the top of the list, but you can resort the grid to your preference by clicking on any column heading.
Note: The Smart Peer Builder displays columns for all four Normalized similarity scores (Overall Similarity, Patient Mix Similarity, Geographic Similarity, and Structural Similarity) by default, but you have the option to add the column for the Euclidean distance score from the Column Settings tab.
Important: Please be aware that all of the facility attributes displayed on Peer Facilities tab are not evaluated for similarity scoring. To see the attributes that are evaluated for the Euclidean distance and Normalized Similarity scores, go to the Facility Data tab.
You can add or remove specific columns on this screen from the Column Settings tab.
- The Chart tab displays a 3D spatial chart that provides a visualization of the relative similarity for a subset of 50 most similar facilities to your own facility and to each other.
Your selected facility is the darkest blue plot point in the corner
The weighted and normalized similarity scores for other facilities are represented by color, with the darkest colors being the most similar
Hover your cursor over any plot point to see facility details including the Euclidean distance score (where a lower score is better)
The 3D display can be turned or pivoted to be viewed from any angle. Click on the chart and drag with your mouse to pivot to another viewing angle.
For example:
- The Facility Data tab includes data specific to the facility chosen in the Facility drop down in #1 above. This tab is where you can see the facility attributes that are evaluated for the Euclidean distance and Normalized Similarity scores, including:
Zip Code
Bed Count
Case Mix Index (CMI)
Location
Teaching
Academic
CERT Trauma
COTH
ICU Beds
Cardiac Beds
Neonatal Beds
Pediatric beds
OB Beds
Psych Beds
- The Column Settings tab is where you choose to add or remove columns from the main display on the Peer Facilities tab. You can click in a check box next to a column on the list to either add or remove the column from your screen.
|
|
*The Euclidean Distance (Raw) Score is the only column not selected to display by default. **These attributes are updated regularly in QualityAdvisor. Top Performers are updated annually, while Five-Star Ratings are updated on a quarterly basis. |
3. Domain Weights
Located at the top of the screen are three slider features that allow you to customize the weightings you want to emphasize for each of the domains for Patient Mix, Geography, and facility Structure. The default setting for each domain is set to a weight of 1. As you change the weightings by adjusting slide settings between 1 and 10, the facility list in the grid automatically updates to reflect the facilities that are now most similar based on the new weight settings.
Note: The weights are evaluated relative to each other. Equivalent weights applied to all three domains are applied equally.
For example; weights of 1, 1, and 1 are evaluated in the same manner as weights of 10,10, and 10
4. Export
Use the Export option to export the list of Premier peer facilities to a MS Excel spreadsheet.
Note: The exported copy will include all 200 peer facilities and is not limited to only those facilities you select for the peer group.
Saving a Peer Group
To select a facility to include in your peer group, click in the check box in the first column on the Peer Facilities tab next to each facility.
There is no limit to the number of facilities you can select, but be aware that the final peer group must be in compliance with the External Peer Methodology before you can save the group. A validation error will alert you if the rules have not been satisfied, including if you have not met the five facility rule.
Once you have completed all of your facility selections, click on the Save button at the top of the screen. The saved peer group is now available for selection from the Peer prompt under User Defined Groups.
Important Reminder! Peer groups created within the Smart Peer Builder are static just as a Peer Facility peer group is when it is created directly within Custom Groups. You should plan to reevaluate peer groups periodically to make updates as needed.