July 17, 2023 Release Notes
Expand any topic listed below to see the details included in this release.
With this July 2023 release, Premier has added a new Resource Opportunity analysis and three new resource metrics to QualityAdvisor. These are intended to assist you when reviewing your resource costs and utilization.
The new analysis allows you to see the cost & utilization opportunities, as compared to peers, in one report without having to do your own calculations. The three new resource metrics that are part of this analysis are also added to the existing SPL Resource Analysis (Peer version only).
Highlights of the new analysis are included below. Please see the Resource Opportunity report level page for more details.
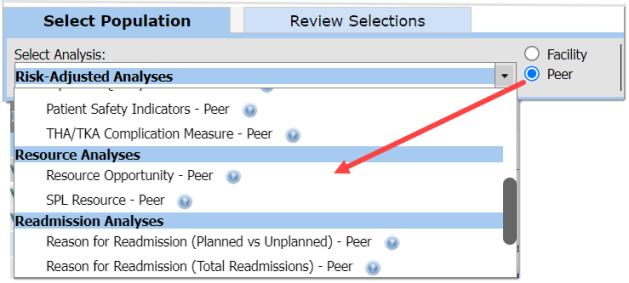
New Resource Opportunity Analysis (Peer)
The new Resource Opportunity analysis is added to the Resource Analyses section on the Standard Analyses for Peer menu.
-
There is no Facility version of this new analysis
-
The new analysis is not risk-adjusted
-
The new analysis is available for both CareScience and 3M™
-
The new analysis is not available in QA Insights
-
The three new resource metrics are available in QA Insights
-
The new analysis does not include the Set Up Analysis tab, but standard drilling and report objects are available
Three New Resource Metrics
The new Resource Opportunity analysis includes three new resource metrics that are also available within the Peer version of the SPL Resource analysis. The new metrics are:
-
Opportunity to Peer – an overall measure of potential cost opportunity compared to the peer group
-
Cost Per Quantity Opportunity – a measure to help determine if your facility’s cost to deliver care is higher than the peer group
-
Utilization Opportunity – a measure to help determine if your facility is using more resources than the peer group
About the New Metrics:
Opportunity to Peer displays in the first column on the report, and is calculated as follows:
Cost/Case Variation x Cases for Facility
After calculating the overall opportunity to peer, the next logical step is to determine what is actually driving the cost opportunity. Are your facility’s resource costs higher than the peer? Or are you simply using more resources? The Opportunity to Peer measure is designed to be broken down into the two additional new columns so you can determine what’s driving your opportunity:
Cost Per Quantity Opportunity represents the total impact of the difference in cost/quantity between facility and peer. The formula used to calculate this keeps % utilization and quantity/resource case constant. Resources with a higher facility cost compared to the peer and used at high volumes will lead to a larger dollar amount of opportunity. The formula for this is as follows:
(Facility Cost/Quantity - Peer Cost/Quantity) x Facility Quantity/Resource Case x Facility Resource Cases
Utilization Opportunity represents the total impact of the difference in % utilization and quantity/resource case. The formula used to calculate this keeps cost/quantity constant.
[(( Facility Cases x % Use Variation) x (Peer Quantity/Resource Case) + (Facility Resource Cases x Quantity/Resource Case Variation) x Peer Costs/Quantity]
As stated above, the Opportunity to Peer measure is a composite of Cost Per Quantity Opportunity and Utilization Opportunity. Essentially, the value in the Opportunity to Peer column should equal the sum of the value in Cost Per Quantity Opportunity column + the value in the Utilization Opportunity column.
Note: The new metrics are included on the SPL Resource (Peer) analysis report objects by default, however they are not added to any of your My Saved Analyses by default. To include the new metrics within a My Saved Analysis, a new SPL Resource (Peer) analysis will need to be run and then saved.
The metrics are not available in Custom Query.
Go to the Archives to see Release Notes for previous releases