Facility Profiling
This analysis lists all Perspective Database facilities and their attributes, which provides valuable information you can use when selecting and creating comparative peer groups of facilities with particular attributes. Use this analysis to identify potential peer facilities in the system.
Note: Starting with the June 2020 release, the metrics on this report are based on the CMS fiscal year 2019 (October 1, 2018 to September 30, 2019)
Description
The analysis includes demographic and operational data about the facility, such as location, bed size, case mix index (CMI), and whether procedure practitioners are linked to ICD-10 codes. You can examine the characteristics for facilities that meet certain criteria or for all facilities in the database.
The sources used to produce this analysis include the Official National Hospital Blue Book and information submitted to the Perspective Database.
Note: Drilling is not available on this analysis.
Metrics
Metrics are created using facility-reported data for the fiscal year (CMI, Reported Discharges, Outpatients, ER Visits, % Medicare, % Medicaid, and % Managed Care). Therefore, if a facility did not submit all four quarters of data for the year, the data might be underrepresented. If a facility does not have any data for the fiscal year, these fields are blank.
The following table outlines the metrics on the Facility Profiling analysis:
|
Metric |
Definition |
|---|---|
|
Facility Name |
Name of the facility. |
|
Facility City |
City in which the facility is located. |
|
Facility State |
State in which the facility is located. |
|
Location |
Type of facility location: Rural, Urban, or NA indicates a facility serving a specialized patient population. |
|
Facility Cost Type |
Type of facility costing method, either Procedural or Ratio of Cost to Charges (RCC). |
|
COTH/ Non-COTH |
Indicates whether the facility is a teaching facility based on the COTH classifications. COTH = Teaching Non-COTH = Non-Teaching. |
|
Number Total Beds |
Total number of actual licensed beds. |
|
Number Acute Beds |
Total number of acute care beds. |
|
Number Sub Acute Beds |
Total number of sub acute care beds. |
|
Number of Neonatal Level 1 Beds |
Total number of Neonatal Level 1 care beds. |
|
Number of Neonatal Level 2 Beds |
Total number of Neonatal Level 2 care beds. |
|
Number of Neonatal Level 3 Beds |
Total number of Neonatal Level 3 care beds. |
|
Number of Neonatal Level 4 Beds |
Total number of Neonatal Level 4 care beds. |
|
Number of Peds Beds |
Total number of Pediatric care beds. |
|
Number of PICU Beds |
Total number of Pediatric ICU care beds. |
|
Number of Psych Beds |
Total number of psych beds. |
|
CMI FY |
Case mix index for fiscal year; this is calculated at the facility level based on data contained in the Comparative Database. Important! Due to the inclusion and exclusion differences between the facility-level CMI and the patient-level CMI it is possible that the CMI FY value for a facility on the Facility Profiling analysis may not match the patient-level CMI on either the Custom Query or Custom Comparison analyses for the same facility.
As a result, total cases used to calculate facility-level CMI FY may not match the total cases used to calculate patient-level CMI for the same facility and therefore could yield different CMI results. |
|
Cases – Reported Discharges FY |
Number of reported inpatient discharges for the fiscal year based on the Inpatient/Outpatient flag. |
|
Cases – Outpatients FY |
Number of reported outpatient visits for the fiscal year based on the Inpatient/Outpatient flag. Includes emergency room visits. |
|
Cases – ER Visits FY |
Total emergency room visits for the fiscal year, including patients admitted to the facility through the emergency room. |
|
%Medicare (Inpatient) FY |
Percentage of Medicare inpatient cases for the fiscal year based on the Medicare Perspective Database Payer code. |
|
%Medicaid (Inpt) FY |
Percentage of Medicaid inpatient cases for the fiscal year based on the Medicaid Perspective Database Payer code. |
|
%Managed Care (Inpatient) FY |
Percentage of Managed Care inpatient cases for the fiscal year based on the PPO, HMO and Managed Care patient Perspective Database Payer codes. |
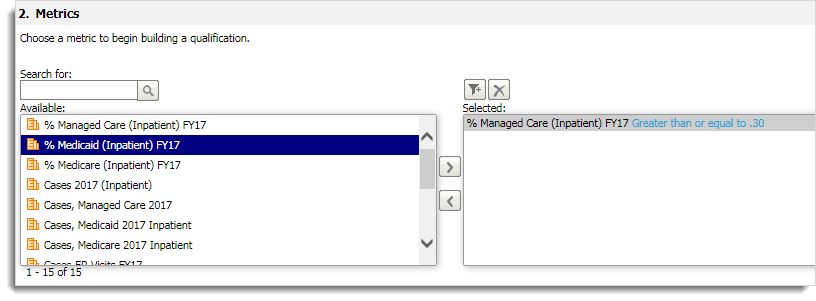
Percentage Metrics
When you enter a value for percentage metrics, enter the value as a decimal. For example, to see facilities with % Managed Care equal to 30%, enter .30 for the Value.