Data Vintage Factor Adjusted Outcomes - Peer CareScience
This analysis can be generated for any timeframe available in QualityAdvisor and will provide automated Data Vintage Factor (DVF) adjustment across calibration years, so that data is stabilized for an uninterrupted continuation of trending after calibration takes place.
Select Population Tab:There are 4 required prompts that you must select before running this analysis. Required Prompts:
Optional Prompts:
Set Up Analysis Tab:Optional Prompt
|
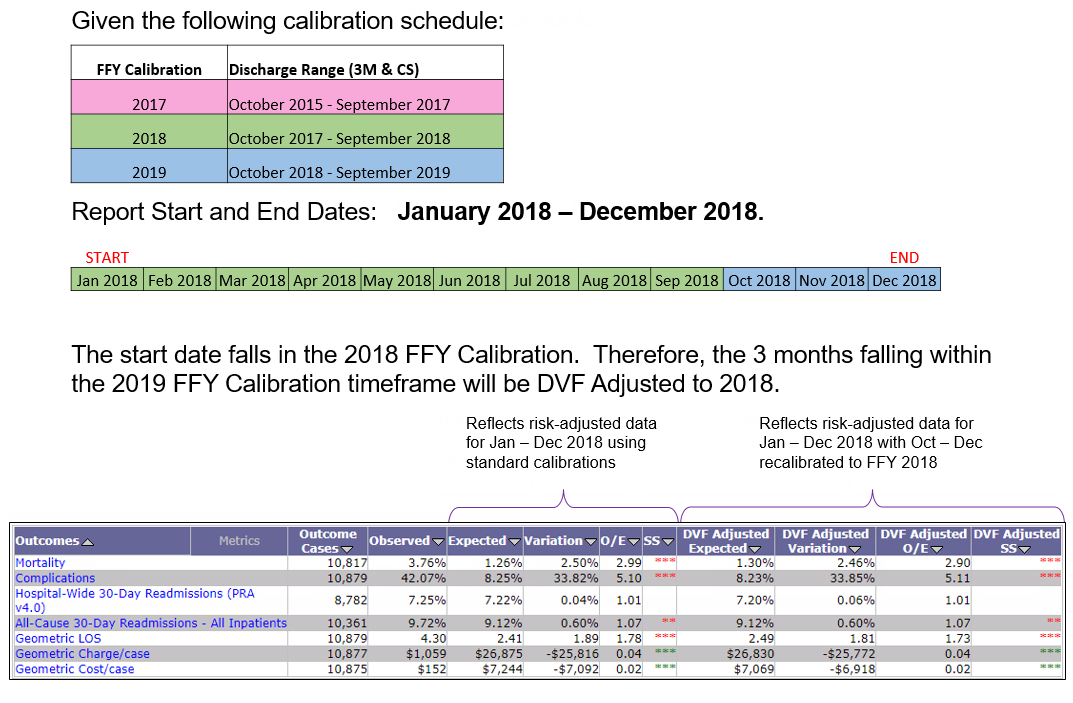
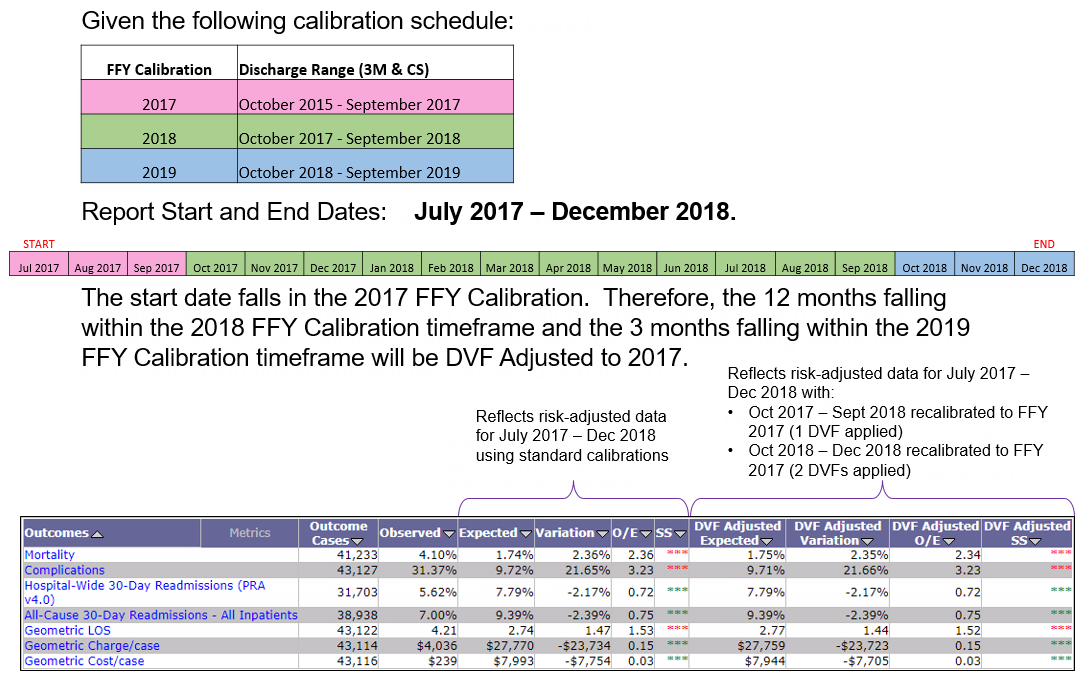
Based on the start and end dates selected, DVFs are automatically adjusted on the report across current and previous CareScience risk-models so that the aggregate level outcomes are stabilized.
Notes:
- For the most accurate report results, it is recommended that the report time frame should not cross more than 3 risk-adjustment model time frames, even though 5 years are provided within QualityAdvisor
- Risk-adjustment model time frames are not equal to CareScience calibration years. In some instances, the calibration time frame combined more than one year (for example CSA 2017 was based on 10/1/2015 - 10/1/20/17). The specific readmission timeframes are listed below
Select a scenario link below to expand sample reporting calculation
Calibration Timeframes
| Calibration Year |
2021 |
2022 |
2023 |
2024 |
2025 |
|---|---|---|---|---|---|
| Discharges | 10/1/2020 - 9/30/2021 | 10/1/2021 - 9/30/2022 | 10/1/2022 - 9/30/2023 | 10/1/2023 - 9/30/2024 | 10/1/2024 - TBD |
| Mortality | X | X | X | X | X |
| LOS (Geometric) | X | X | X | X | X |
| Charge (Geometric) | X | X | X | X | X |
| Cost Geometric | X | X | X | X | X |
| Complication | X | X | X | X | X |
| Total Inpatient Readmission | X |
X |
X |
X |
X |
| Readmission v4.0 2020 | X | ||||
| Readmission v4.0 2021 |
|
X |
|
|
|
| Readmission v4.0 2022 | X | ||||
| Readmission v4.0 2023 |
|
|
|
X |
Readmission Timeframes
|
Readmission Version |
Timeframe |
|---|---|
|
All-Cause 30-Day Readmissions Methodology for All Inpatients |
|
|
All-Cause Hospital-Wide 30-Day Readmission (HWR) Methodology Based on PRA v4.0 2023 |
|
DVF Adjusted Values
The DVF Adjusted values on the report are the aggregate values for the timeframe selected in the report prompts. These values are calculated at the disease-stratum level per patient (CCS for CareScience), and per risk-adjustment model timeframe(s).
Outcomes Included on the Analysis
The following outcomes appear in the grid when the analysis returns:
-
Mortality
-
Complications
-
CMS All-Cause Hospital-Wide 30-Day Readmission (HWR) Methodology Based on PRA v4.0 2023
-
All Cause 30-Day Readmission - All Inpatients
-
Geometric LOS
-
Geometric Charge/case
-
Geometric Cost/case
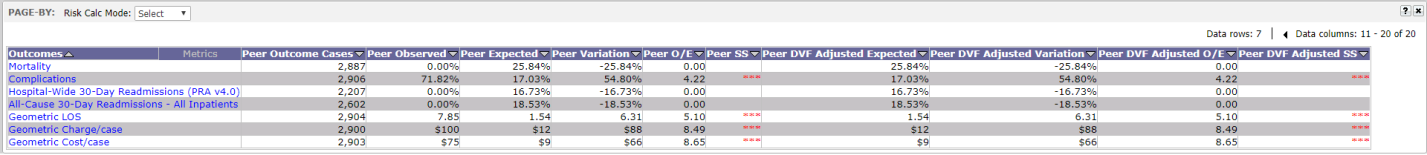
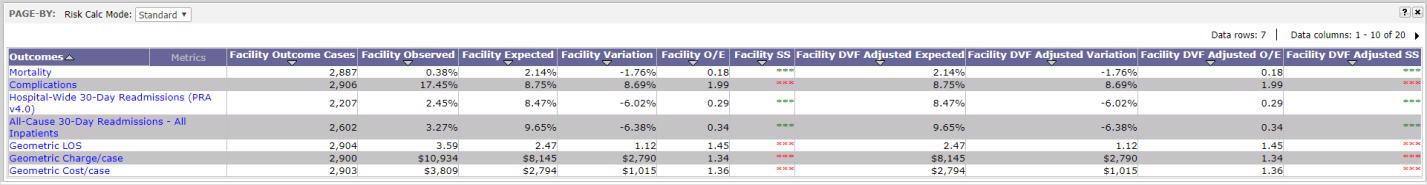
Analysis Sample
Choose either Standard or Select view
(Showing columns 1-10)
(Showing columns 11-20)