Health Equity Analysis – Facility CareScience
This analysis is intended to understand how health disparities impact patient Mortality and Readmission outcomes, as related to patient demographics.
Select Population Tab:There are 3 required prompts that you must select before running this analysis. Required Prompts:
Optional Prompts:
|
The demographics analyzed include:
-
Age Group
-
Gender
-
Race
-
Ethnicity
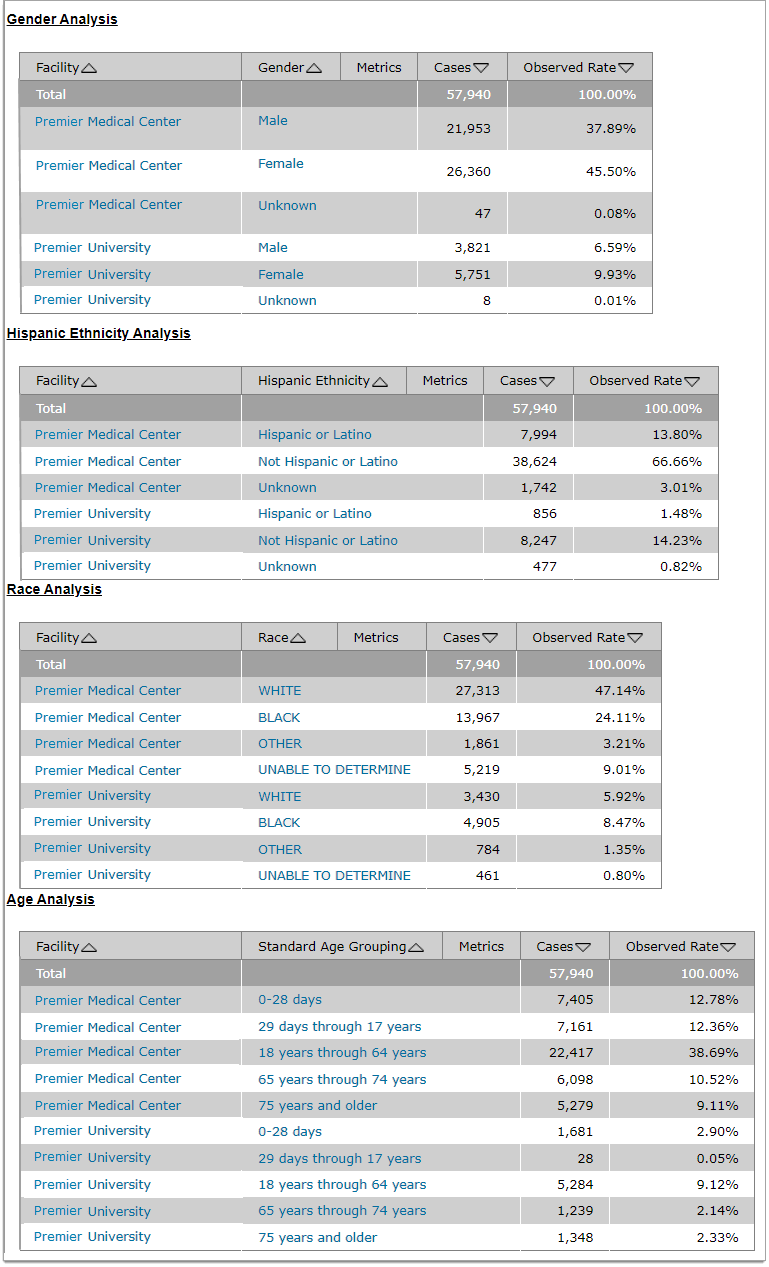
Each demographic chart includes:
-
Facility
-
{The Metric}
-
Cases
-
Observed Rates
Demographic Chart Samples
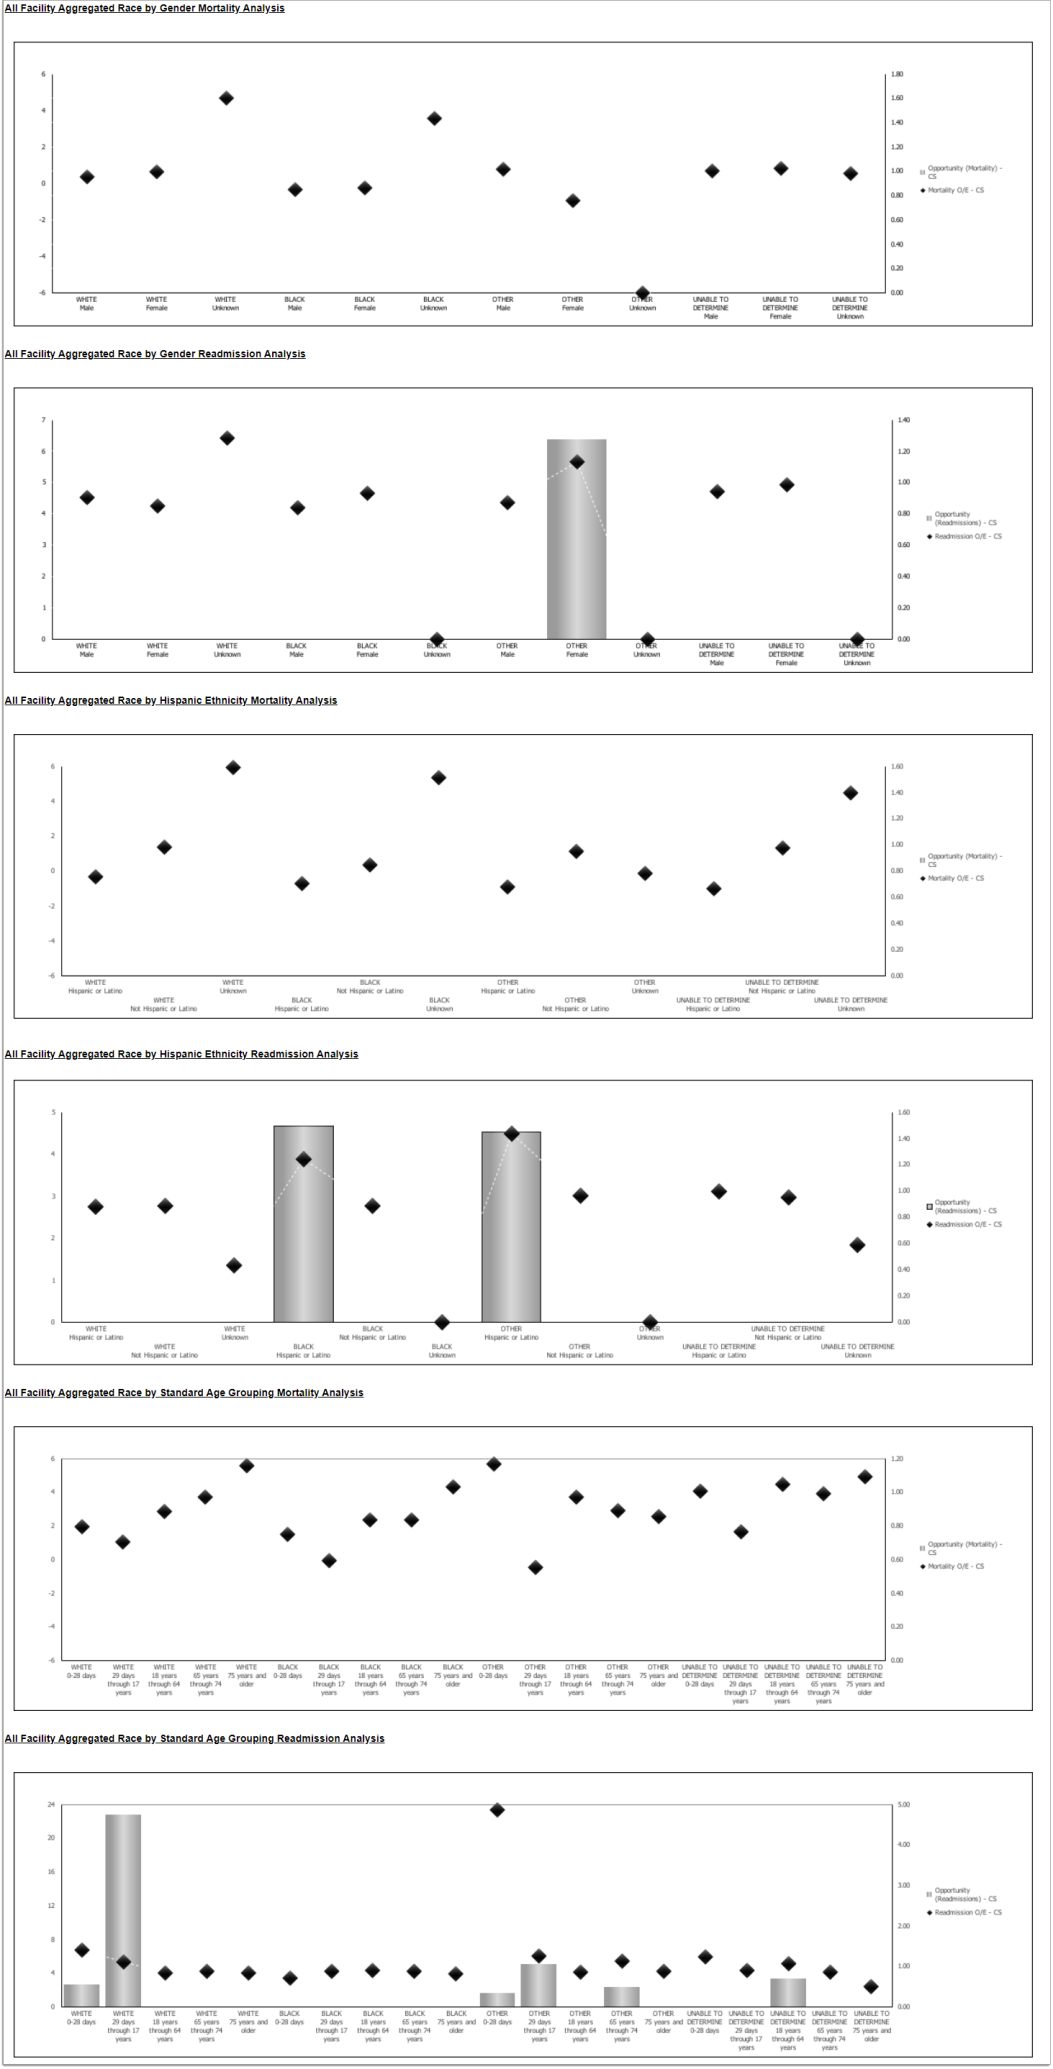
The Outcomes include:
-
All Facility Aggregated Race by Gender Mortality
-
All Facility Aggregated Race by Gender Readmission
-
All Facility Aggregated Race by Ethnicity Mortality
-
All Facility Aggregated Race by Ethnicity Readmission
-
All Facility Aggregated Race by Standard Age Grouping Mortality
-
All Facility Aggregated Race by Standard Age Grouping Readmission
Each Outcome graph includes:
-
Opportunity (charted with a gray bar)
-
O/E (charted with black diamonds)
Outcome Graphs Samples