ICU Outcomes Comparison — Facility
This analysis allows a health system or facility to view the top 10 diagnoses by volume that resulted in an ICU stay to gain a better understanding of ICU LOS, Returns to the ICU, and ICU Mortality (both patients that died in the ICU, and patients that died after being in the ICU).
Note: A billing file is required to be submitted for data to return on this report.
Please see ICU Risk Adjustment for additional details.
Notes
-
All results listed for Cases in the "Show Items" actually reflect Total ICU Cases, not overall cases
-
There is no Population Count button because this report is based on a subset of the total inpatient population and totals would not line up
-
As with other analyses, there is a 50,000 Row Limit. If a report returns more than 50,000 rows, an error message is displayed. You will then need to adjust your report criteria
-
ICU Episode drill is counted at the Episode level. Therefore, the count will not match ICU Cases
Select Population Tab:There are 3 required prompts that you must select before running this analysis. Required Prompts:
Optional Prompts:
Set Up Analysis Tab:There is 1 required prompt that you must select before running this analysis. Required Prompt
Optional Prompts:
|
Report Structure
The report includes a combination of grid and graph visualizations across three tabs:
Top 10- ICU Comparison Tab
-
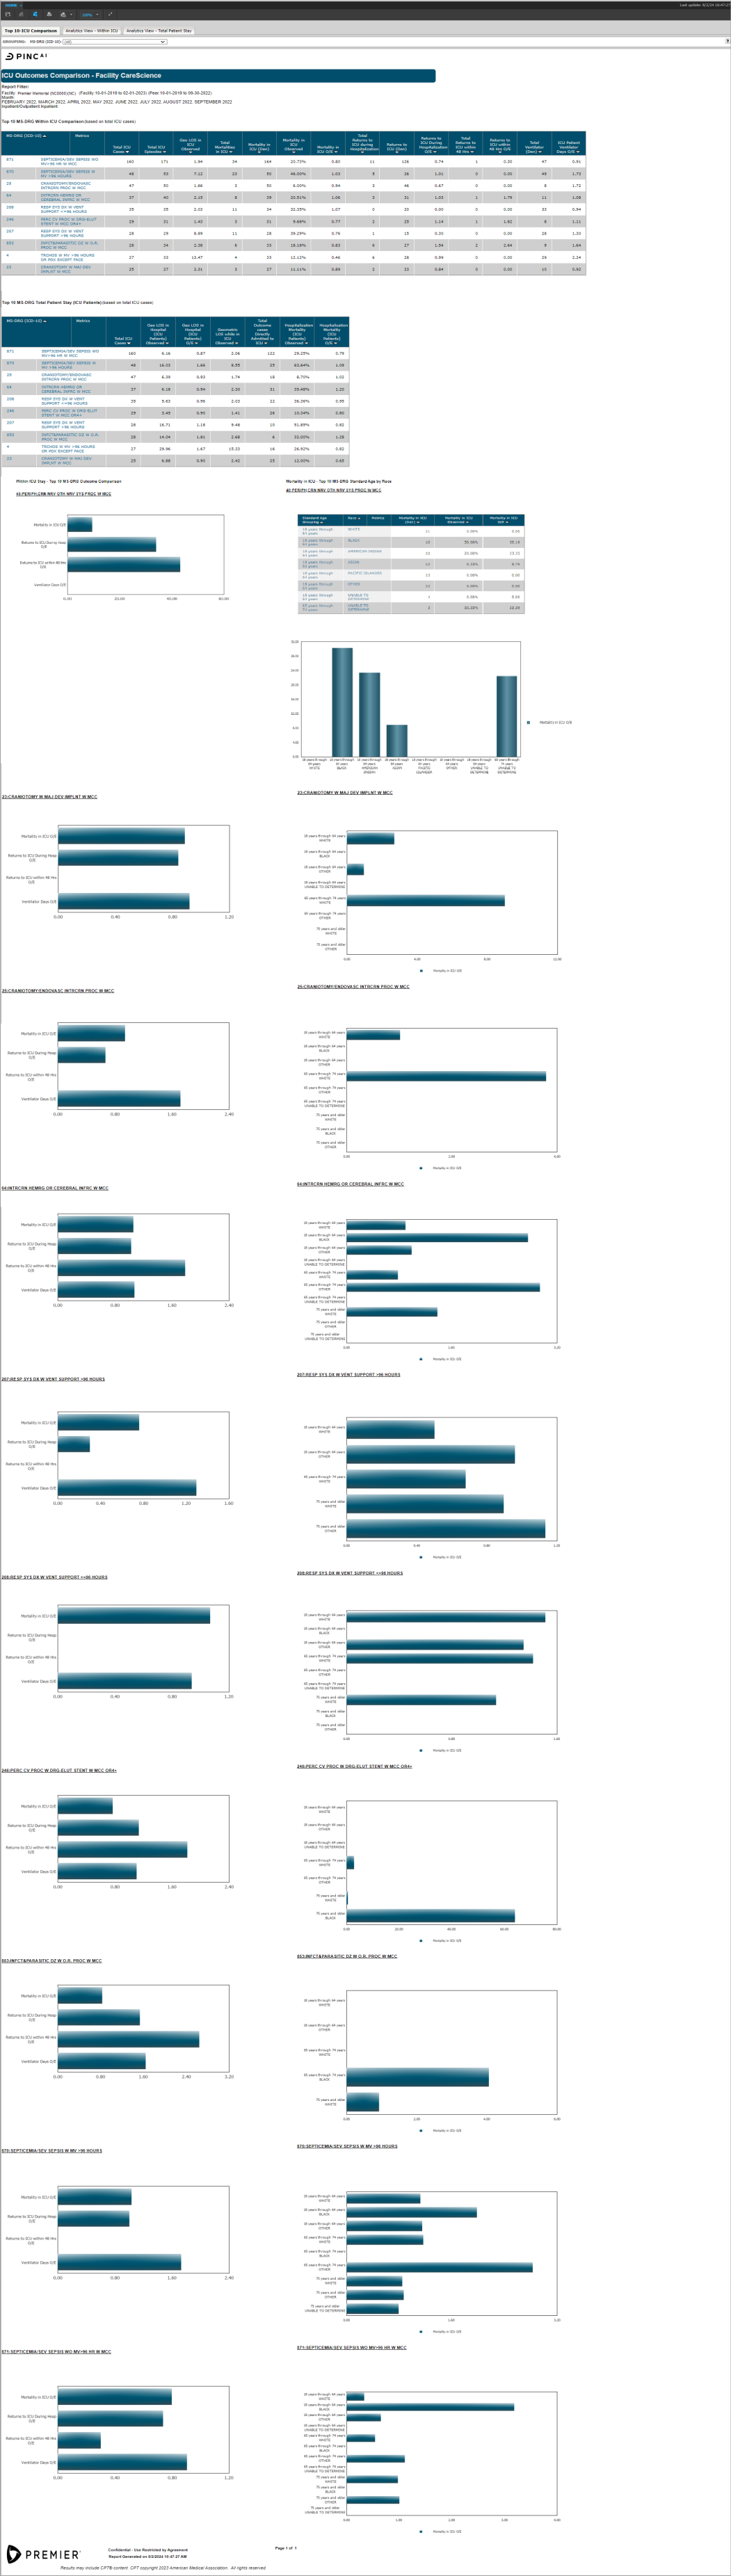
Includes a section that returns the Top 10 MS-DRG Family by volume (based on total ICU cases calculated at the episode level) that resulted in an ICU stay
Top 10 MS-DRG Family Within ICU Comparison (based on total ICU cases) Example:
-
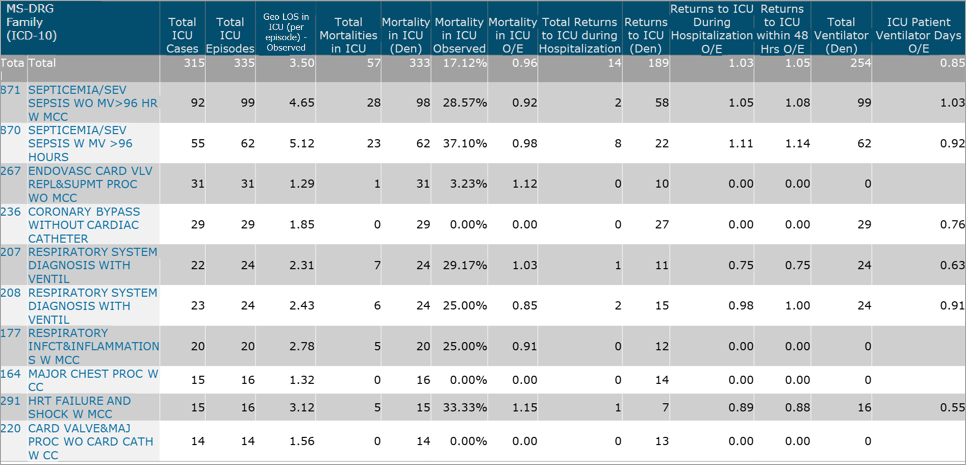
Includes a separate section that returns the Top 10 MS-DRG Family that is looking at your ICU patients full hospital stay. These metrics are calculated at the patient level
Top 10 MS-DRG Family Total Patient Stay Example:
-
Includes graphs for the "Top 10 MS-DRG Families"
1st graph is an Outcome Comparison
2nd graph is an age by race breakout for the patients that died in the ICU with a supplemental grid that includes the facility denominator, observed, and O/E values
Analytics View-Within ICU Tab
-
Includes all MS-DRG Family and all ICU outcome metrics (except LOS) for the "Within ICU Comparison" grid
-
This view is calculated at the episode level
-
Includes full drill maps from the grid row header
-
Includes hyperlink to drill to the ICU Episode (facility version only)
Analytics View-Total Patient Stay Tab
-
Includes all MS-DRG Family and all ICU outcome metrics for the "Total Patient Stay (ICU Patients)" grid
-
This view is calculated at the patient level
-
Includes full drill maps from the grid row header
Default Metrics - Facility
MS-DRG Family are sorted by the highest "Total ICU Cases" in descending order on the report. The metric list below is sorted alphabetically and does not match the order of display on the report.
-
Geometric LOS in Hospital (ICU Patients) Expected
-
Geometric LOS in Hospital (ICU Patients) O/E
-
Geometric LOS in Hospital (ICU Patients) Observed
-
Geometric LOS in Hospital (ICU Patients) Opportunity
-
Geometric LOS in Hospital (ICU Patients) Statistical Significance
-
Geometric LOS in Hospital (ICU Patients) Variation
-
Geometric LOS in ICU (per episode) Expected
-
Geometric LOS in ICU (per episode) O/E
-
Geometric LOS in ICU (per episode) Observed
-
Geometric LOS in ICU (per episode) Opportunity
-
Geometric LOS in ICU (per episode) Statistical Significance
-
Geometric LOS in ICU (per episode) Variation
-
Geometric LOS while in ICU Observed
-
Hospitalization Mortality (ICU Patients) Expected
-
Hospitalization Mortality (ICU Patients) O/E
-
Hospitalization Mortality (ICU Patients) Observed
-
Hospitalization Mortality (ICU Patients) Opportunity
-
Hospitalization Mortality (ICU Patients) Statistical Significance
-
Hospitalization Mortality (ICU Patients) Variation
-
ICU Patient Ventilator Days Expected
-
ICU Patient Ventilator Days O/E
-
ICU Patient Ventilator Days Observed
-
ICU Patient Ventilator Days Opportunity
-
ICU Patient Ventilator Days Statistical Significance
-
ICU Patient Ventilator Days Variation
-
Mortality in ICU (Den)
-
Mortality in ICU Expected
-
Mortality in ICU O/E
-
Mortality in ICU Observed
-
Mortality in ICU Opportunity
-
Mortality in ICU Statistical Significance
-
Mortality in ICU Variation
-
Returns to ICU (Den)
-
Returns to ICU During Hospitalization Expected
-
Returns to ICU During Hospitalization O/E
-
Returns to ICU During Hospitalization Observed
-
Returns to ICU During Hospitalization Opportunity
-
Returns to ICU During Hospitalization Statistical Significance
-
Returns to ICU During Hospitalization Variation
-
Returns to ICU within 48 Hrs. Expected
-
Returns to ICU within 48 Hrs. O/E
-
Returns to ICU within 48 Hrs. Observed
-
Returns to ICU within 48 Hrs. Opportunity
-
Returns to ICU within 48 Hrs. Statistical Significance
-
Returns to ICU within 48 Hrs. Variation
-
Total ICU Cases
-
Total ICU Episodes
-
Total Mortalities in ICU
-
Total Outcome Cases Directly Admitted to ICU
-
Total Returns to ICU during Hospitalization
-
Total Returns to ICU within 48 Hrs
-
Total Ventilator (Den)
Drill to ICU Episode
The metrics in the "Analytics View - Within ICU" grid are calculated at the ICU Episode level. Even though the report is at the MS-DRG Family roll-up level and results reported in aggregate, you can drill to the patient detail level to see results at the ICU Episode level. Outcome calculations can vary per episode.
On the "Analytics View - Within ICU" tab, a new hyperlink titled "Drill to Patient ICU Episode" is added. When selected, a patient list opens in a new browser tab. Note: This feature is not added to the Analytics View - Total Patient Stay" tab.
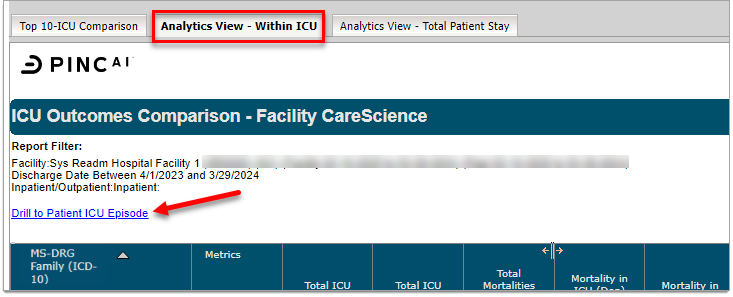
The patient list includes all patients that qualify for the drill and is not filtered by MS-DRG Family. However, the Page-by functionality can then be used to filter by MS-DRG Family if needed.
The patient ID is a hyperlink that links to the existing "Facility All Patient Detail Analysis" drill template. No additional drills are available from the ICU Episode drill patient list.
The patient list includes:
Row attributes:
-
Patient ID
-
*ICU Episode
-
*Service Start Date - start date of the corresponding ICU Episode
-
*Service End Date - end date of the corresponding ICU Episode
-
Discharge Date
*Not added to Custom Query.
Column Headers:
-
Mortality in ICU
-
Returns to ICU During Hospitalization
-
Returns to ICU within 48 Hrs.
-
LOS in ICU
-
ICU Patient Ventilator Days
Note: Observed, Expected, and O/E are calculated at an ICU Episode level.
Frequently Asked Questions
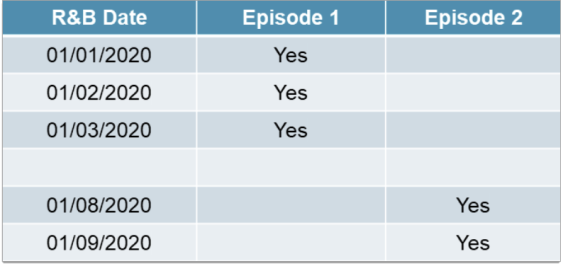
LOS in ICU is counted for each ICU stay separately. In the following example, the patient had two ICU episodes. The first episode had LOS in ICU as 3 days and the second as 2 days. In the encounter-based report, this patient’s total LOS in ICU is counted as 5 days.
Day count is calculated by ICU Room and Board by billing dates, and exact hours of day is unknown. Therefore, this metric is dependent on billing practice.
For example, in a case where a patient was admitted in ICU on 01/01 and transferred to another site of care in the sample hospital on 01/02, LOS in ICU would be counted as 1 day if ICU Room and Board was only billed only on 01/01. However, LOS in ICU would be counted as 2 days if ICU Room and Board was billed on both 01/01 and 01/02.
To be included in the ventilator days report, a patient’s record needs to have at least one ICU R&B charge, one mechanical ventilation charge, one ICD procedure code indicating mechanical ventilation. However, our calculation does not check the alignment of the date stamp of these three conditions. We recognized that these date stamps may not always be aligned due to imperfect data.
Bar Graphs
There are two columns of bar graphs.
-
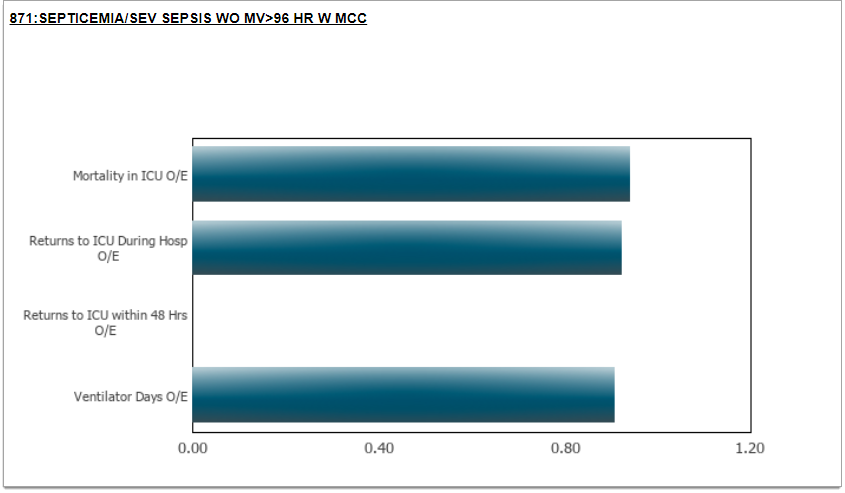
The first column includes the Within ICU Stay- Top 10 MS-DRG Family Outcome Comparison graphs
-
The second column includes the Mortality in ICU- Top 10 MS-DRG Family Standard Age by Race graphs
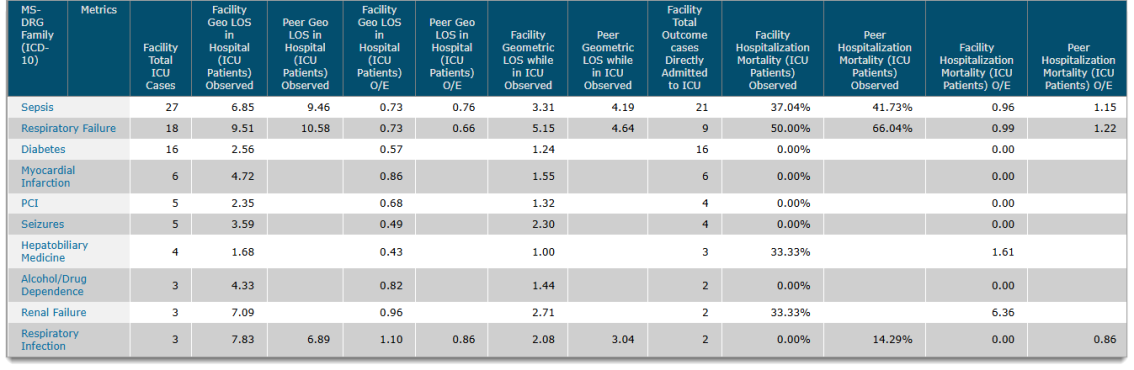
Within ICU Stay- Top 10 MS-DRG Family Outcome Comparison
-
Shows the outcomes per MS-DRG Family for the Top 10 based on total ICU cases (facility and peer)
-
X-axis- O/E for each of the below "Within ICU Comparison" Outcomes"
-
Y-axis- "Within ICU Comparison" Outcomes
-
Mortality in ICU
-
Returns to ICU During Hospitalization
-
Returns to ICU within 48 Hrs.
-
ICU Patient Ventilator Days
-
Sample Graphs
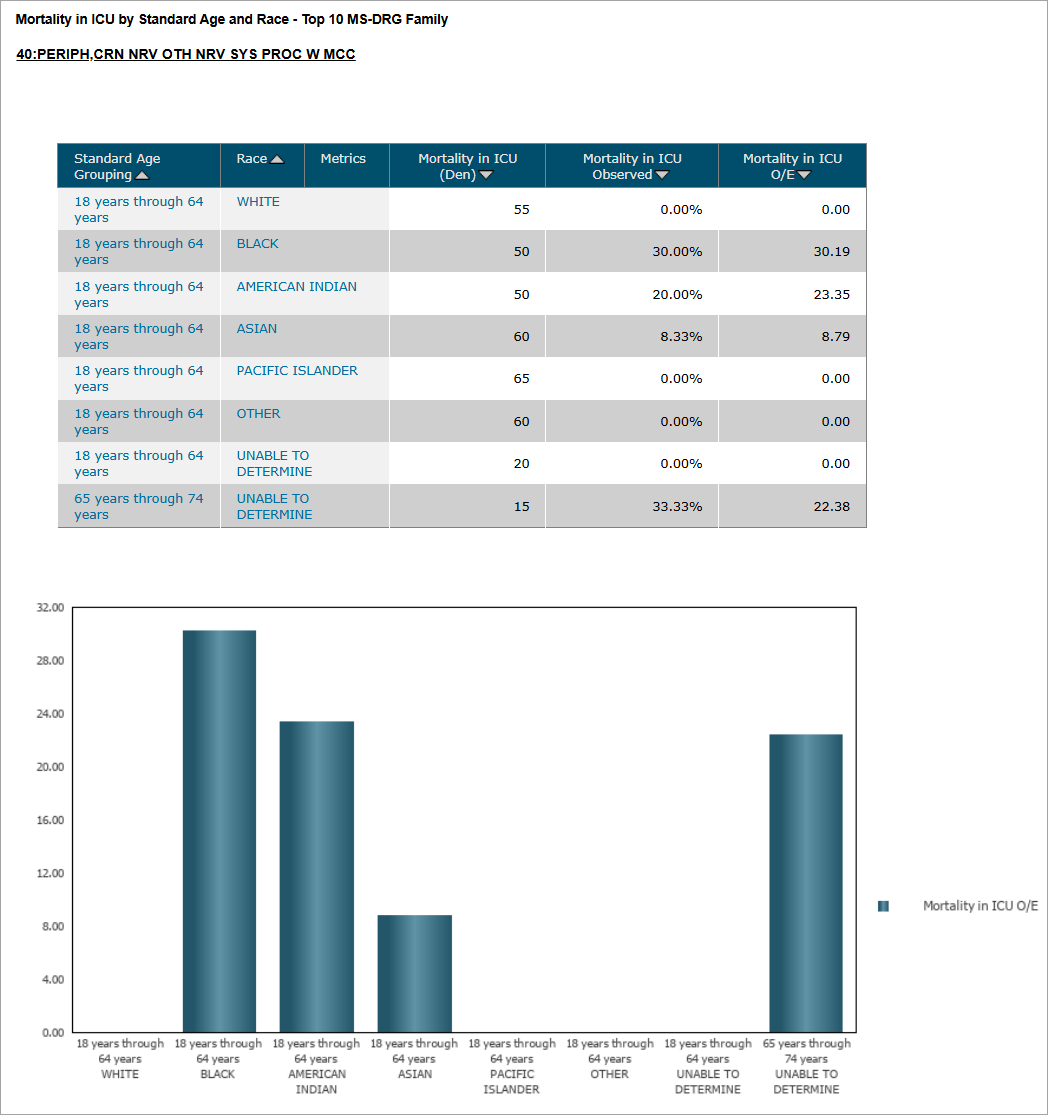
Mortality in ICU- Top 10 MS-DRG Family Standard Age by Race
-
The health equity view for the outcome and age by race grouping
-
Facility Grid
-
Row headers: Standard Age Grouping, Race
-
Columns: Mortality in ICU (Den), Mortality in ICU Observed, Mortality in ICU O/E
-
-
Facility Graph
-
X-axis - Standard Age Groupings by all Race
-
Y-axis - Mortality in ICU O/E
-
Groupings:
-
Standard Age: 18 years through 64 years, 65 years through 74 years, 75 years and older
-
Race- all applicable race values
-
Sample Graphs