Percentile Ranking Dashboard
The Percentile Ranking Dashboard displays percentile rankings at the outcome level, comparing your facility's (or facilities) percentile ranking per outcome, against the rankings of peer facilities for the same outcomes.
Sample
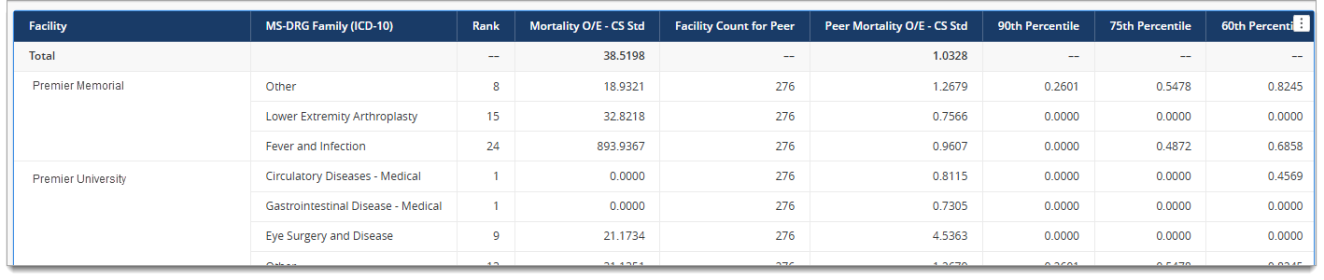
Note: Data in the sample screen is not representative of actual data.
Selecting Dashboard Criteria
There are five required prompts you must select before generating a dashboard: four required prompts on the Select Population tab and one required prompt on the Set Up Analysis tab.
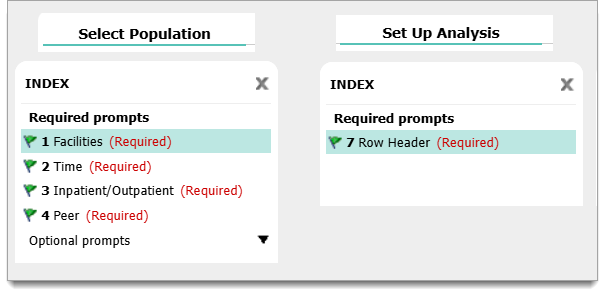
The required prompts include:
-
Facilities
-
Time
-
Inpatient/Outpatient
-
Peer - (You must choose at least five facilities and comply with the External Peer Methodology. Additionally, If less than five of your selected peers have comparatively published data, then the corresponding rows on the dashboard display a dash ( - ) instead of O/E and percentile results)
-
Row Header - (At least two Row Header attributes are required to run the dashboard, and the "Facility" attribute must be included for the dashboard to return correctly. The "Facility" attribute is pre-selected in the prompt for this reason, and you should not remove this attribute prior to running the dashboard. Once the dashboard returns, you will have the flexibility to remove “Facility” from the row, and customize your display based on the attributes you choose in the prompt)
Note: For the Row Header prompt on the Set Up Analysis tab, we have defaulted "Facility" and "MS-DRG Family (ICD-10)" as row headers you will find helpful on your dashboard. You can remove the "MS-DRG Family (ICD-10)" attribute prior to running the dashboard and replace with a different Row Header attribute, but you must not remove the "Facility" attribute.
There are also two optional prompts on the Select Population tab you can use to further customize your dashboard results.
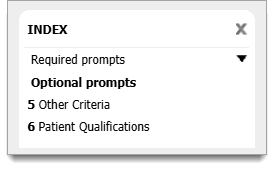
The optional prompts include:
-
Other Criteria — such as Procedures, Patient Demographics, Standard Payers etc.
-
Patient Qualifications — such as Charges, Fixed Costs etc.
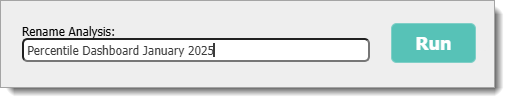
Once you have selected the criteria you want included on your dashboard, go to the bottom right corner of the screen. Here you can enter a name for the dashboard based on the criteria you have select.
-
Click on the Run button to generate your dashboard
Note: The dashboard will only include the following CareScience Risk-adjusted Outcomes and Patient Safety Indicators:
| Percentiles | Outcomes |
|---|---|
|
90th 75th 60th 50th 25th 20th 10th |
• All-Cause Hospital-Wide 30-Day Readmission (PRA v4.0 2023) O/E • All-Cause Hospital-Wide 30-Day Readmission (PRA v4.0 2024) O/E • All-Cause 30-Day Readmissions - All Inpatients O/E • Mortality O/E • Complications O/E • Geometric LOS O/E • Geometric Cost/Case O/E • PSI-02- Death in Low Mortality DRGs Rate/1000 (V2024) • PSI-03- Pressure Ulcer Rate/1000 (v2024) • PSI-04- Death in Surg Pts with Treatable Comp Rate/1000 (V2024) • PSI-05- Retained Surgical Item or Unretrieved Device Fragment Rate/1000 (V2024) • PSI-06- Iatrogenic Pneumothorax Rate/1000 (v2024) • PSI-07- Central Venous Catheter Related Blood Stream Infection Rate/1000 (V2024) • PSI-08- In Hospital Fall With Hip Fracture Rate/1000 (v2024) • PSI-09- Postoperative Hemorrhage or Hematoma Rate/1000 (v2024) • PSI-10- Postoperative Acute Kidney Injury Requiring Dialysis Rate/1000 (v2024) • PSI-11- Postoperative Respiratory Failure Rate/1000 (v2024) • PSI-12- Perioperative PE or DVT Rate/1000 (v2024) • PSI-13- Postoperative Sepsis Rate/1000 (v2024) • PSI-14- Postoperative Wound Dehiscence Rate/1000 (v2024) • PSI-15- Abdominopelvic Accidental Puncture or Laceration Rate/1000 (v2024) • PSI-17- Birth Trauma Injury to Neonate Rate/1000 (V2024) • PSI-18- OB Trauma Vaginal Delivery with Instrument Rate/1000 (V2024) • PSI-19- OB Trauma Vaginal Delivery w/o Instrument Rate/1000 (V2024) |
The Dashboard Layout
Outcome Tabs
Due to the limited space available on the screen, each outcome is presented on a separate tab. The PSI tab includes a drop down menu allowing you to view results for one PSI at a time. The outcome tabs are listed across the bottom of the dashboard:
-
Click on any tab to view the results for each outcome or PSI
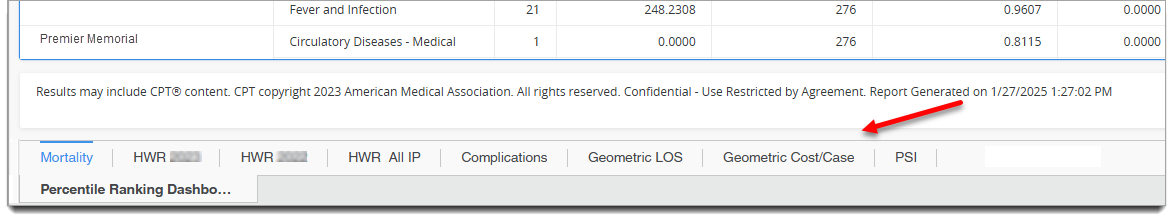
Note: The HWR Outcome tabs will always reflect the two most recent HWR versions on QualityAdvisor.
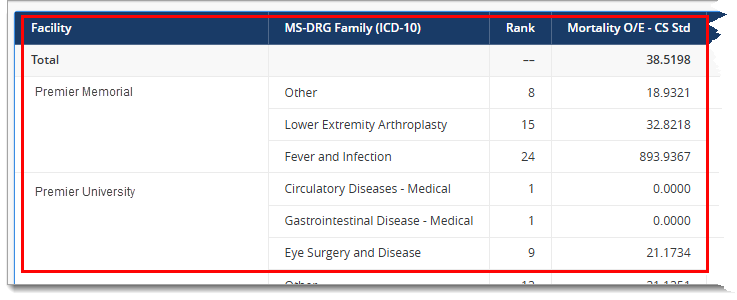
Dashboard Columns
The columns of data on the dashboard include:
-
Facility — Selected by default by Premier. The "Facility" attribute is required for the dashboard to return correctly
-
Second (Required) Row Header — "MS-DRG Family (ICD-10)" is pre-selected by default by Premier, but you can remove this attribute in favor of attributes of your choosing. You must have a second Row Header option, but you are not limited to two choices. Note: The defaulted "MS-DRG Family (ICD)" column will automatically display on the dashboard, but any other attributes you choose will need to be added manually after the dashboard returns. This functionality is explained in more detail in the Dashboard Editing Panels section below
-
Rank — Rank is the rank for the selected facility's Outcome O/E. A numerical rank value is assigned to each facility included in the dashboard starting with the value of 1, where 1 is viewed as the best or top ranked facility for the outcome. The rank is based on the outcome's "Facility O/E," and is independently assigned per outcome (i.e., ranking will be different on each outcome tab)
-
Outcome O/E — The outcome corresponds to the selected outcome tab you are viewing
-
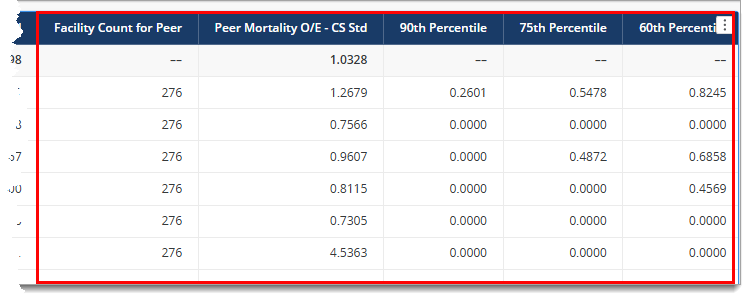
Facility Count for Peer — The Facility Count for Peer column shows how many of the selected peer facilities have valid data included in the dashboard. For example, if you selected 50 peer facilities and the column only displays 40, then 10 of the selected peer facilities did not have valid data
-
Peer Outcome O/E — The outcome corresponds to the selected outcome tab you are viewing
-
90th - 10th Percentiles — These columns show the O/E percentile breakout for each row of the dashboard. The 90th percentile is the higher performing facilities of the peer group that you selected
Dashboard Editing Panels
The left side of the dashboard screen displays the Dashboard Editing Panels. These panels display by default, but once you have your dashboard set up to your liking, you can hide the panels to allow a larger space for viewing the dashboard data.
Note: The options you choose using the Editing Panels to set up your dashboard display do not carry over to each outcome tab. For example, if you add additional Row Headings on the Mortality tab, those added columns are not automatically added to any additional outcome tabs. You may need to repeat your set up steps on each tab.
The panels include:
-
Datasets — This panel includes Row Headers that were defaulted by Premier and/or the Row Headers you selected on the Set Up Analysis prompt. It also includes all of the columns that can display across all of the outcome tabs
Note: Due to technical constraints, only the "Facility" and the "MS-DRG Family (ICD-10)" columns will automatically display on the dashboard. If you chose to remove the "MS-DRG Family (ICD-10)" Row Header attribute prior to running the dashboard then only the "Facility" column will automatically display. All of the additional Row Headers you selected will display in the Datasets panel, and you must manually move them over onto the dashboard display.
-
Editor — This panel shows all of the columns that are currently selected to display on the dashboard. You can drag and drop items from the Datasets panel into either the Editor panel or directly onto the dashboard. Note: You can also remove columns from the dashboard display.
The sample screens below illustrate dragging and dropping the Standard Primary Payer row header from the Datasets panel into the Editor panel, and alternatively directly onto the dashboard:
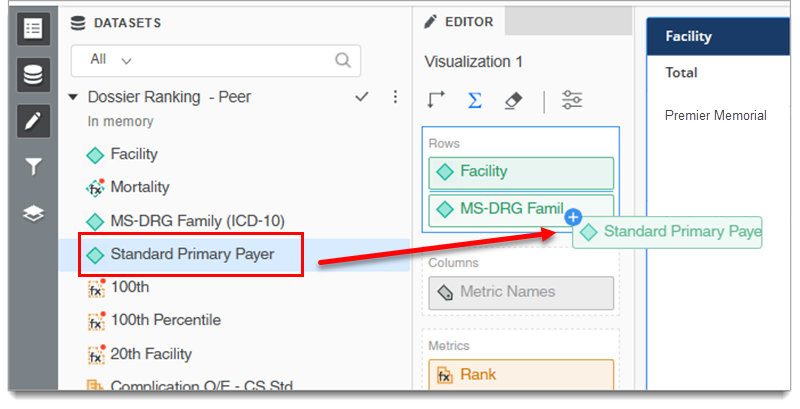
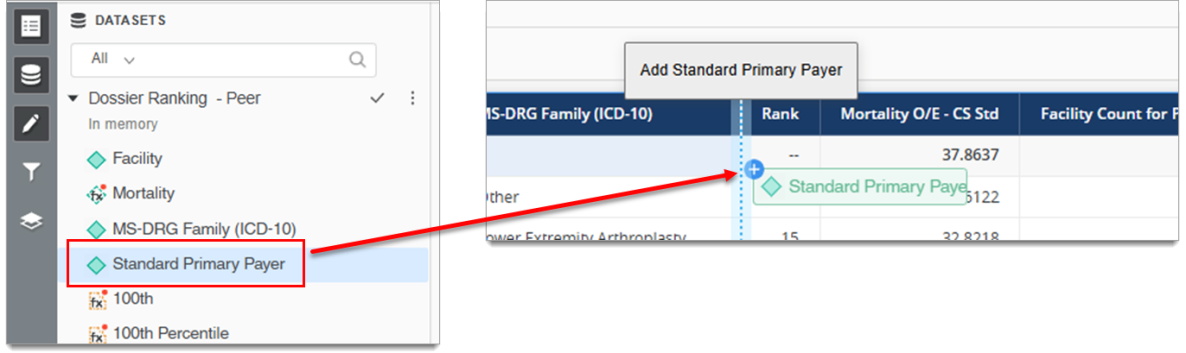
Important: All of the values (i.e., Totals, O/E values, Rank and percentile results) displayed on the dashboard reflect the results based on all of the prompt selections you made before running the dashboard. For example, if you selected Facility, MS-DRG Family (ICD-10), and Standard Primary Payer in the Row Header prompt, the values in each cell on every tab on the dashboard reflect results using all of your criteria regardless of whether you add or remove row headers on the dashboard display.
-
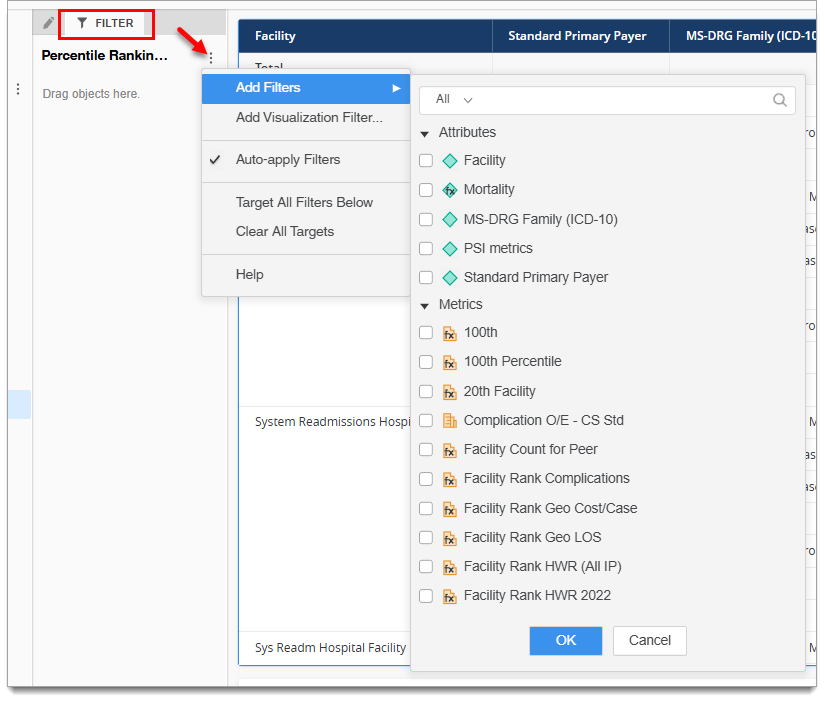
Filter — The filter icon is located on the far left below the Editor icon. When selected, the Filter panel replaces the Editor panel. Use this panel to add filters to your dashboard to parse the data you want to view
-
Layers — The layers icon is located at the far left below the Filter icon. When selected, the Layers panel opens on the right side of the dashboard
Exporting
You can export your dashboard as either an Excel or CSV spreadsheet, or as a PDF document.
-
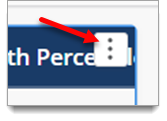
To export, click on the icon with three dots at the top right corner of the dashboard
-
Then expand the Export option and select which file type you prefer
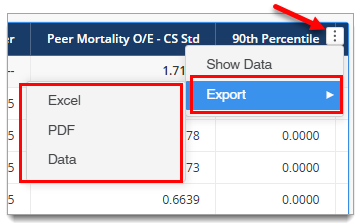
Both the Excel and CSV (Data) options download directly to your browser for you to open and save to your computer.
The PDF option will ask you to choose your desired document settings, such as page orientation and paper size, before proceeding with the export.