Tips for Selecting Timeframes - Standard Analyses, Custom Query, & Outpatient View
It is important to be mindful to the custom timeframe you select for QualityAdvisor analyses.
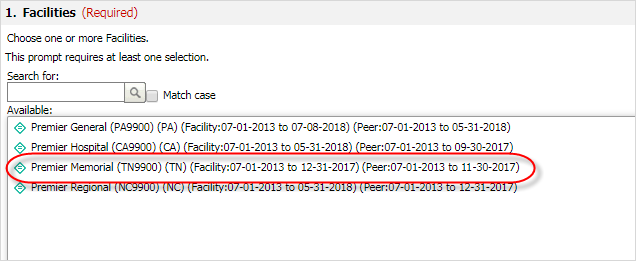
The examples below will refer to Premier Memorial’s data availability here:
Standard Readmission Analyses / Readmission Metrics in Custom Query
Risk-adjusted Readmission Analyses (both CS and 3M™) - These are 30 day readmission analyses.
- If the analysis is run on the most recent month available, patients returning within 30 days in the following month will not be counted. Therefore, we suggest moving the timeframe back at least 1 month for facility or peer analyses
- Premier Memorial Example: We suggest running these analyses with an end date of November 2017 for facility or peer analyses
Reason for Readmission Analyses (both Total and Planned vs. Unplanned) – These analyses allow the user to enter a readmission timeframe between 0-365 days.
- If the user enters 30, the timeframe should be moved back 1 month from what is available
- If the user enters 90, the timeframe should be moved back 3 months from what is available
- If the user enters 365, the timeframe should be moved back 12 months from what is available
- Premier Memorial Example: If the user enters 30, the analysis should be run ending with November 2017
Standard SPL Resource Analyses & Cost Analyses / Resource & Cost Metrics in Custom Query
- Comparative Publish requires Cost Data and Resource Mappings to be complete. Facility published timeframes may have inaccurate or incomplete cost and charge data
- We suggest running these analyses with timeframes containing comparatively published data only
- Premier Memorial Example: Run a facility or peer analysis with an end date of November 2017
THA/TKA Complication Measure Analysis
- This analysis contains complications measures up to 90 days of the index admission date
- We suggest the timeframe be moved back 3 months from what is available
- Premier Memorial Example: the analysis should be run ending with September 2017
Outpatient View
- The Outpatient View Report focuses on return visits within 30 days to the ED from select outpatient settings. If the dashboard is run ending December 2017, patients returning in January 2018 will not be counted
- We suggest moving the timeframe back at least 1 month from what is available
Data Vintage Factor Adjusted Outcome Analysis
- This analysis provides automated Data Vintage Factor (DVF) adjustment across calibration years, so that the data is stabilized for the continuation of trending after the annual database calibration update occurs in QualityAdvisor
- The timeframe selection for the report determines the number of DVF's applied to each patient
- We suggest the report timeframe should not cross more than 3 risk-adjustment model timeframes for the most accurate report results
Example: a report is generated in July 2019 for discharges from 1/1/2017 – 12/30/2018
- The report begin date indicates that the expected values will be automatically adjusted back to the 2017 CSA model, and there have been two calibration updates since then (June 2018 and June 2019)
- All patients within the analysis with discharges outside of the 2017 CSA FFY will be adjusted back to 2017 as if the 2018 & 2019 calibrations did not occur
Patients discharged within the 2019 calibration timeframe will be adjusted twice (2 DVFs)
Patients discharged within the 2018 calibration timeframe will be adjusted once (1 DVF)
Patients discharged within the 2017 calibration timeframe will not have a DVF applied