Outcome Profile - Facility 3M™
This analysis allows you to evaluate all outcomes for a defined population, which helps narrow the search for an opportunity for improvement. Use this analysis to see all the metrics for all the outcomes at-a-glance.
Select Population Tab:There are 3 required prompts that you must select before running this analysis. Required Prompts:
Optional Prompts:
Set Up Analysis Tab:Row Header Prompt
Optional Prompts:
|
Default Metrics
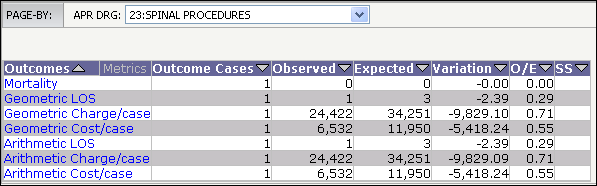
On this analysis, each row is an outcome: Mortality, Cost, Charge, LOS, etc. The following metrics return for each outcome when the grid returns:
For the Mortality Outcome:
- Outcome Cases - The number of cases for the Mortality outcome that qualified for risk adjustment. Based on the Outcome Case methodology, some cases may not qualify for risk adjustment.
- Observed -The number of patient deaths in the Mortality Outcome Cases.
- Expected - The expected value for the Outcome Cases, calculated using the 3M™ risk-adjustment methodology.
- Variation - The Observed value minus the Expected value.
- O/E - The Observed value divided by the Expected value. Less than 1 = performing better than expected. Greater than 1 = performing worse than expected.
- SS - Asterisks display only if the Variation is statistically significant. The number of asterisks indicates the confidence level that the outcome's variation is not due to chance: 1 asterisk = 75%, 2 asterisks = 95%, 3 asterisks = 99%. Green asterisks = the outcome’s variance is statistically better than expected. Red asterisks = the outcome’s variance is statistically worse than expected. Total lines do not have values for Statistical Significance.
For the Geometric LOS Outcome:
- Outcome Cases - The number of cases for the LOS outcome that qualified for risk adjustment. Based on the Outcome Case methodology, some cases may not qualify for risk adjustment.
- Observed - The geometric mean length of stay (LOS) for the LOS Outcome Cases.
- Expected - The expected value for the Outcome Cases, calculated using the 3M™ risk-adjustment methodology and the geometric mean.
- Variation - The Observed value minus the Expected value.
- O/E - The Observed value divided by the Expected value. Less than 1 = performing better than expected. Greater than 1 = performing worse than expected.
- SS - Asterisks display only if the Variation is statistically significant. The number of asterisks indicates the confidence level that the outcome's variation is not due to chance: 1 asterisk = 75%, 2 asterisks = 95%, 3 asterisks = 99%. Green asterisks = the outcome’s variance is statistically better than expected. Red asterisks = the outcome’s variance is statistically worse than expected. Total lines do not have values for Statistical Significance.
For the Geometric Cost Outcome:
- Outcome Cases - The number of cases for the Cost/Case outcome that qualified for risk adjustment. Based on the Outcome Case methodology, some cases may not qualify for risk adjustment.
- Observed - The cost/case for the Cost Outcome Cases.
- Expected - The expected value for the Outcome Cases, calculated using the 3M™ risk-adjustment methodology and the geometric mean.
- Variation - The Observed value minus the Expected value.
- O/E - The Observed value divided by the Expected value. Less than 1 = performing better than expected. Greater than 1 = performing worse than expected.
- SS - Asterisks display only if the Variation is statistically significant. The number of asterisks indicates the confidence level that the outcome's variation is not due to chance: 1 asterisk = 75%, 2 asterisks = 95%, 3 asterisks = 99%. Green asterisks = the outcome’s variance is statistically better than expected. Red asterisks = the outcome’s variance is statistically worse than expected. Total lines do not have values for Statistical Significance.
For the Geometric Charge Outcome:
- Outcome Cases - The number of cases for the Charge/Case outcome that qualified for risk adjustment. Based on the Outcome Case methodology, some cases may not qualify for risk adjustment.
- Observed - The charge/case for the Charge Outcome Cases.
- Expected - The expected value for the Outcome Cases, calculated using the 3M™ risk-adjustment methodology and the geometric mean.
- Variation - The Observed value minus the Expected value.
- O/E - The Observed value divided by the Expected value. Less than 1 = performing better than expected. Greater than 1 = performing worse than expected.
- SS - Asterisks display only if the Variation is statistically significant. The number of asterisks indicates the confidence level that the outcome's variation is not due to chance: 1 asterisk = 75%, 2 asterisks = 95%, 3 asterisks = 99%. Green asterisks = the outcome’s variance is statistically better than expected. Red asterisks = the outcome’s variance is statistically worse than expected. Total lines do not have values for Statistical Significance.
For the Arithmetic LOS Outcome:
- Outcome Cases - The number of cases for the LOS outcome that qualified for risk adjustment. Based on the Outcome Case methodology, some cases may not qualify for risk adjustment.
- Observed - The arithmetic mean length of stay LOS for the LOS Outcome Cases.
- Expected - The expected value for the Outcome Cases, calculated using the 3M™ risk-adjustment methodology and the arithmetic mean.
- Variation - The Observed value minus the Expected value.
- O/E - The Observed value divided by the Expected value. Less than 1 = performing better than expected. Greater than 1 = performing worse than expected.
- SS - Asterisks display only if the Variation is statistically significant. The number of asterisks indicates the confidence level that the outcome's variation is not due to chance: 1 asterisk = 75%, 2 asterisks = 95%, 3 asterisks = 99%. Green asterisks = the outcome’s variance is statistically better than expected. Red asterisks = the outcome’s variance is statistically worse than expected. Total lines do not have values for Statistical Significance.
For the Arithmetic Cost Outcome:
- Outcome Cases - The number of cases for the Cost/Case outcome that qualified for risk adjustment. Based on the Outcome Case methodology, some cases may not qualify for risk adjustment.
- Observed - The cost/case for the Cost Outcome Cases.
- Expected - The expected value for the Outcome Cases, calculated using the 3M™ risk-adjustment methodology and the arithmetic mean.
- Variation - The Observed value minus the Expected value.
- O/E - The Observed value divided by the Expected value. Less than 1 = performing better than expected. Greater than 1 = performing worse than expected.
- SS - Asterisks display only if the Variation is statistically significant. The number of asterisks indicates the confidence level that the outcome's variation is not due to chance: 1 asterisk = 75%, 2 asterisks = 95%, 3 asterisks = 99%. Green asterisks = the outcome’s variance is statistically better than expected. Red asterisks = the outcome’s variance is statistically worse than expected. Total lines do not have values for Statistical Significance.
For the Arithmetic Charge Outcome:
- Outcome Cases - The number of cases for the Charge/Case outcome that qualified for risk adjustment. Based on the Outcome Case methodology, some cases may not qualify for risk adjustment.
- Observed - The charge/case for the Charge Outcome Cases.
- Expected - The expected value for the Outcome Cases, calculated using the 3M™ risk-adjustment methodology and the arithmetic mean.
- Variation - The Observed value minus the Expected value.
- O/E - The Observed value divided by the Expected value. Less than 1 = performing better than expected. Greater than 1 = performing worse than expected.
- SS - Asterisks display only if the Variation is statistically significant. The number of asterisks indicates the confidence level that the outcome's variation is not due to chance: 1 asterisk = 75%, 2 asterisks = 95%, 3 asterisks = 99%. Green asterisks = the outcome’s variance is statistically better than expected. Red asterisks = the outcome’s variance is statistically worse than expected. Total lines do not have values for Statistical Significance.
For more information, see Metrics on the Risk-Adjusted Analyses.
Metrics in Report Objects
There are no additional metrics in Report Objects for this analysis.
Analysis Sample
In the following sample, APR DRG was selected for the Optional Page-By prompt on the Set Up Analyses: