All-Cause 30-Day Readmissions Methodology for All Inpatients
For patient discharges 10/1/2020 and forward
This methodology evaluates readmissions within 30 days of an index visit (including same-day readmissions) for all Inpatient patient types.
This methodology is available via the following Analyses:
- Risk-Adjusted 30-Day Readmission - Facility and Peer (CareScience )
- System 30-Day Readmission - Facility (CareScience)
- CareScience Outcome Profile - Facility (CareScience)
- Custom Comparison Analysis - Facility and Peer (CareScience)
- Non Risk-Adjusted Outcomes - Facility
- Custom Query
Overview
This section provides an overview of the All-Cause 30-Day Readmission Methodology for All Inpatients:
- Interval: Within 30 days
- All-Cause: Patients readmitted with any diagnosis
- Patient Type: All inpatient types
- Same-Day Readmissions: Included
- Readmission Rate: The Observed value is the readmission rate
- Risk Method: CareScience Standard Practice or Select Practice
- Planned Readmission Algorithm: None
Numerator and Denominator Exclusions
Cases excluded from the numerator are the cases that are not considered readmissions.
Cases excluded from the denominator are the cases that are not considered eligible index admissions. The denominator cases are the outcome cases.
|
These are excluded from the... |
Numerator |
Denominator |
|---|---|---|
|
Outcome Cases exclusions |
|
X |
Important Terms for Risk-Adjusted Readmissions
These are the key concepts for working with risk-adjusted readmissions.
Index Admission
As defined by CMS, an index admission is the hospitalization considered for the readmission outcome.
The CareScience Analytics Risk-Adjusted Readmissions methodology focuses on index admissions that have readmissions. Tracking index admissions can indicate opportunities for improvement in hospital readmissions.
Readmission
A readmission is an inpatient admission of the same patient within 30 days of a previous admission to the same facility, regardless of the admission cause. For each index admission, the first subsequent admission for the same patient is eligible to be a readmission.
Readmission Risk Score
A risk score is the estimated probability that a readmission to the same facility may occur within 30 days from the discharge date. A readmission risk score is calculated for each index admission qualifying for outcome cases.
Interval
The interval is the number of days between the index admission’s Discharge Date and readmission visit’s Admission Date. For 30 Day readmissions, the interval is within 30 days. For example:
Index Visit Discharge Date = December 20, 2024
Readmission Visit Admission Date = December 27, 2024
Interval = 7 Days
Timeframe
The timeframe is the period of time included in the analysis determined by selections at the Time prompt.
The timeframe selected within the analysis is for the index visit only. In order to capture all readmitted visits, move your “Through” date back 30 days from what has been Facility Published.
Please see Tips for Selecting Timeframes for more information.
CareScience Analytics Risk-Adjustment for Readmissions
CareScience Analytics is used to calculate Observed and Expected values. CareScience Analytics is the risk-adjustment methodology defined by researchers within Premier based on in-depth clinical and analytical research techniques that is currently used to calculate mortality, cost, charge, LOS, and complications. This same team developed CareScience Analytics risk adjustment for the readmissions outcome.
Index Admissions
The readmissions risk-adjustment process starts with identifying the eligible index admissions and readmissions. Index admissions and readmissions are defined by how the admissions relate to each other within the parameters selected at the prompts (such as Facilities and Time).
After the index admissions and readmissions are identified, a risk score is calculated for each index admission using the same risk factors that CareScience Analytics uses to calculate risk scores for other outcomes such as mortality, LOS, and cost. The risk scores for the index admissions are then aggregated to calculate the Expected value on the analysis.
Risk scores are calculated for index admissions (as opposed to readmissions) because Expected values measure the likelihood that a patient will be readmitted based on the circumstances of the index admission. When a patient is readmitted, there is no likelihood of readmission to measure because the readmission has already occurred. Therefore, when calculating the Expected value, only the risk scores for the index admissions are included in the calculation.
In the following example of Patient A for the month of June 2021, only the risk scores from the index admissions are used to calculate the Expected value.
|
Patient |
Admission Date |
Discharge Date |
Admission Type |
Risk Score? |
|---|---|---|---|---|
|
Patient A |
6/2/21 |
6/4/21 |
Index |
Y |
|
Patient A |
6/10/21 |
6/15/21 |
Readmission/Index* |
Y |
|
Patient A |
6/20/21 |
6/26/21 |
Readmission/Index* |
Y |
|
Patient A |
6/30/21 |
7/7/21 |
Readmission (patient expired) |
N |
*A readmission can be linked to only one previous index admission. As a result, for patients with multiple admissions within the timeframe of one analysis, one admission can count as both an index admission and a readmission.
On the Risk-Adjusted 30-Day Readmission analysis:
- The Outcome Cases are the index admissions that qualified for the analysis and the denominator in the Observed value.
- The attribute on the row represents the index admissions that had that attribute.
- You can drill to the Risk-Adjusted Readmissions Patient Visit Detail analysis to see which visits are index admissions. Index admissions are indicated by an “I” in the Readmission Visit column.
Logistic Regression Model
For the Length of Stay outcome, CareScience Analytics uses a semi-log regression model to derive the risk score. For the Readmission and Mortality outcomes, CareScience Analytics uses a logistic regression model (aka logit model) to derive the risk score.
Logistic regression is highly effective at estimating the odds that an event will occur given a set of conditions. For readmissions, it’s the odds that a readmission will occur based on the clinical, patient selection, and demographic characteristics of the index admission.
Logistic regression is best suited for binary outcomes, which means the outcome can be only one of two options: did occur (1) or did not occur (0). The readmissions outcome is a binary outcome because an unplanned readmission either did occur (1) or did not occur (0) after an index admission.
The readmission risk score estimates the odds that an unplanned readmission will occur (1) given the variables of the index admission. Due to the log-odds transformation of the logit model applied when calculating the risk score, the readmission risk score is guaranteed to be within the bound of 0 and 1.
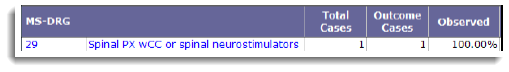
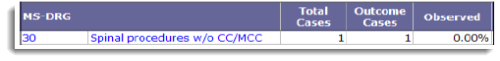
If there is an unplanned readmission after an index admission, the index admission is set to 1 and the Observed value is 100%. If there is no readmission, or the readmission is considered planned, the outcome is set to 0 and the Observed value is 0%.
Risk-Adjusted Readmission Metrics
This section describes the risk-adjusted readmission metrics.
Same-Day Readmissions
Since same-day readmissions are defined as being admitted and discharged on the same calendar day, the Admit and Discharge times can distinguish each unique visit, even when taking place on the same calendar day.
- CMS considers patients as “readmitted” if they had an eligible readmission to the same hospital on the same day but for a different condition/procedure. Patients are not considered “readmitted” if the readmission was to the same hospital for the same condition/procedure and on the same calendar day.
- Premier uses admission dates and times to determine the sequence of patient visits, and does not consider conditions/procedures to determine readmissions. This is because by the time Premier receives final billing, it is assumed that all claims considered as the "same condition" have already been merged.
CareScience Standard and Select Practice
QualityAdvisor offers two risk-adjustment calculation modes for analyses using CareScience Analytics: Standard Practice and Select Practice.
The algorithm for both Standard and Select Practice is based on Premier’s database, which identifies readmissions to the same facility in the database.
Total Cases
The total cases are the inpatient index admissions that qualified for the analysis.
Outcome Cases
The outcome cases are the inpatient index admissions that qualified for the analysis and qualified for risk-adjustment.
Outcome Case Exclusions – General
Cases are excluded from the outcome cases if the information required to risk-adjust a patient such as age, admission type, charges, etc. is missing from the case.
Outcome Case Exclusions – Specific to the Readmissions Outcome
Patients with the following discharge statuses are excluded from the outcome cases:
|
Code |
Description |
|---|---|
|
02 |
Discharged/Transferred to Other Facility |
|
05 |
Discharged/Transferred to Cancer Center or Children's Hospital |
|
07 |
Left Against Medical Advice or Discontinued Care |
|
20 |
Expired |
|
40 |
Expired at Home (For Medicare and Tricare claims for Hospice) |
|
41 |
Expired in Medical Facility |
|
42 |
Expired, Place Unknown (For Hospice) |
|
43 |
Discharged/Transferred to Federal Hospital |
|
66 |
Discharged/Transferred to a Critical Access Hospital (CAH) |
|
82 |
Discharged/Transferred to a short term general hospital for inpatient care with a planned acute care hospital inpatient readmission (effective 10/1/2013 discharges) |
|
85 |
Discharged/Transferred to a Designated Cancer Center or Children's Hospital with a planned acute care hospital inpatient readmission (effective 10/1/2013 discharges) |
|
88 |
Discharged/Transferred to a federal health care facility with a planned acute care hospital inpatient readmission (effective 10/1/2013 discharges) |
|
94 |
Discharged/Transferred to a Critical Access Hospital (CAH) with a planned acute care hospital inpatient readmission (effective 10/1/2013 discharges) |
Observed
This is the observed readmission rate for the outcome cases. The calculation is as follows:
Numerator The number of readmissions within 30 days of an index admission
Denominator The number of outcome cases (index admissions)
Both the numerator and denominator have exclusions.
If there is a readmission after an index admission, the Observed value is 100%.
If there is no readmission after an index admission, the Observed value is 0%.
Note: The Observed value for the Mortality outcome works the same way; 100% if the patient expired and 0% if the patient did not expire.
Expected
The Expected Readmission rate measures the likelihood that a readmission may occur within 30 days of the discharge date. Each patient encounter is an index admission and receives a readmission risk score based on certain characteristics of the admission and the condition of the patient upon discharge. The Expected Readmission rate is the average of the readmission risk scores of the index admissions.
Observed/Expected (O/E)
O/E is the Observed value (O) divided by the Expected value (E).
- Outcomes with an O/E less than 1.0 are performing better than expected.
- Outcomes with an O/E greater than 1.0 are performing worse than expected.
Statistical Significance
Statistical Significance for risk-adjusted readmissions is calculated with a Z-test.
Asterisks display for Statistical Significance if the variation between the Observed and Expected values is statistically significant and not due to random chance.
There are three confidence levels: 75%, 95%, and 99%, represented by asterisks.
Variation
Variation is the Observed value minus the Expected value.
- Outcomes with a negative variation are performing better than expected.
- Outcomes with a positive variation are performing worse than expected.
Variation has three levels of Statistical Significance: 75%, 95%, and 99%.
Opportunity (Readmissions)
Variation multiplied by the Outcome Cases. There must be at least one readmission opportunity for a value to display. Readmission opportunities are rounded to the nearest whole number. The metric is available at the facility level only.