Custom Query
Custom Query is an ad hoc query tool that enables you to design and save custom Facility and Peer analyses in QualityAdvisor. It enables you to mix and match population criteria using multiple operators, including “OR.”
Custom Query is available to both 3M™ and CareScience Analytics users.
Custom Query has unique features that neither Custom Comparison nor any of the other Standard Analyses have.
You can do the following only in Custom Query:
- Create more complex populations using the Other Criteria prompt in the Select Population tab.
- Choose unique combinations of rows, columns, and column groupings not possible on any other analysis.
- Include both CareScience Analytics and 3M™ APR DRG values and metrics on the same analysis (for 3M™ users with access to CareScience Analytics).
Note: If 3M™ APR DRG Risk is selected, then the Other Criteria, Row Header, Columns, and Column Grouping prompts will contain both 3M™ and CS Analytics options. - Select metrics, row headers, and column groupings that are available only in Custom Query.
The following metrics are only available in Custom Query:
- Evidence-Based Care Measure Rates and Continuous Measures
- Obstetrics
The following items are available as row headers and column groupings only in Custom Query: - Patient
- Birth Date - Time
- Admission Date - Diagnosis
- Diagnosis (All) Rank
- Secondary Diagnosis Rank
Accessing Custom Query
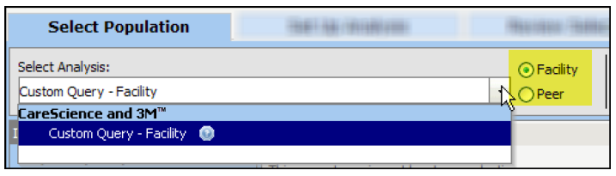
To access, navigate to the top menu bar and click Custom Query.

The prompt window then displays with the versions of Custom Query you have. There are four versions of Custom Query:
- 3M™ Facility
- 3M™ Peer
- CareScience Facility
- CareScience Peer
Note: Prompt options change based on which version of Custom Query you select.
Creating a Custom Query
To create a Custom Query:
- Once you have accessed Custom Query, select either Facility (only facility metrics will appear in the Columns prompt) or Peer (both facility and peer metrics will appear in the Columns prompt) for your query type.
- The rest of the steps are very similar to running any Standard Analysis. First, navigate to the Select Population tab and following on-screen instructions, complete the required and optional prompts.
- Navigate to the Set Up Analysis tab and following on-screen instructions, complete the required and optional prompts.
- Navigate to the Review Selections tab and verify your selections are what you wish to see in the analysis.
- Click Run.
Notes: Once you run an analysis, the prompt selections used are saved and available for running additional queries. If you create a peer query and wish to use the same criteria for a facility query, the prompt selections will be saved within Custom Query.
If you receive an error stating that the maximum number of report rows has been retrieved, your prompt selections are too broad. Return to the prompt windows and narrow your selections.
Report Objects in Custom Query
Custom Query provides reporting objects only at the patient-level. This means that when you choose Total Cost or Total Charge metrics as columns, the values in the analysis will represent patient total costs or charges regardless of the attributes you choose for the rows.
Statistical Significance
When Statistical Significance (SS) appears on the grid, it shows the percentage of significance at three levels – 75%, 95%, 99% - instead of the asterisks that appear on other Standard Analyses.
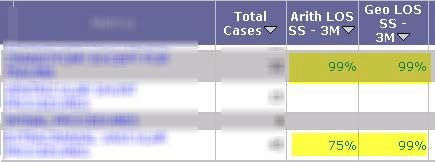
Statistical Significance values are still color-coded:
- Green means that the outcome’s variance is statistically better than expected.
- Red means that the outcome’s variance is statistically worse than expected.
Reporting Across Time Frames
If you include ICD-10 data on an analysis, and a patient who was discharged after January 2012 did not have ICD-10 submitted, you will see the following descriptions for ICD-10 codes on the analysis:
- NO ADMIT
- NO PRINCIPAL DIAG
- NO SECONDARY DIAG
- NO PRINCIPAL PROC
- NO SECONDARY PROC
ICD-10 Reporting in Custom Query (Facility)
ICD-10 reporting is available for Facility reporting only in Custom Query for October 2013 discharges forward. To learn more, visit the ICD-10 Knowledge Center.
Custom Comparison vs. Custom Query
Custom Comparison is a Standard Analysis that allows you to include the metrics you want on one analysis whereas Custom Query is an ad hoc query tool that allows you to customize more aspects of the analysis.
The following table describes the similarities and differences between Custom Comparison and Custom Query:
|
Feature |
Custom Comparison |
Custom Query |
|---|---|---|
|
Versions |
||
|
Is there a Facility version? |
Yes |
Yes |
|
Is there a Peer version? |
Yes |
Yes |
|
Is there a 3M™ version? |
Yes |
Yes |
|
Is there a CareScience version? |
Yes |
Yes |
|
Columns |
||
|
Can I choose the columns i want on the analysis? |
Yes |
Yes |
|
Can I group the columns? |
No |
Yes |
|
Can I choose 3M™ metrics? |
Yes |
Yes |
|
Can I choose CareScience metrics? |
Yes |
Yes |
|
Population Selection Options |
||
|
Can I use the following operators between* prompts? |
||
|
AND |
Yes |
Yes |
|
OR |
No |
Yes |
|
AND NOT |
No |
Yes |
|
*Custom Comparison, like all Standard Analyses, lets you choose these operators for criteria within a prompt but not between prompts. |
||
|
Can I drill on the analysis? |
Yes |
Yes |
|
Can I use Custom Groups? |
Yes |
Yes |
|
Can I use Population Count? |
Yes |
Yes |
|
Can I use Case Counts? |
Yes |
Yes |
|
Can I use Show Items? |
Yes |
Yes |
|
Can I use My Save Analyses? |
Yes |
Yes |
|
Can I use Saved Selections? |
Yes |
Yes* |
|
Can i use Favorites? |
Yes |
Yes* |
* You can use saved selections and Favorites in Custom Query but you cannot shared saved selections and Favorites between Custom Query analyses and Standard Analyses.