August 12, 2024 Release Notes
With this August 2024 release, QualityAdvisor is adding new ICU Risk-Adjusted Metrics and a new ICU Outcomes Comparison Analysis (Facility and Peer versions). Both the risk-adjusted metrics and the new analysis are available for discharges 10/1/2021 and forward only.
New ICU Risk-Adjusted Metrics
Recognizing that the ICU is a department that can be very costly and is at a high risk for poor outcomes, it is an important department to constantly assess. Therefore, Premier is adding new risk-adjusted ICU metrics to allow you to compare outcomes to peer in both a new standard analysis and in Custom Query.
The new risk-adjusted metrics include both ICU Episode Level Metrics as well as ICU Patient Level Metrics.
ICU Episode Level Metrics:
-
Mortality in ICU — Patients that died in an ICU
-
Length of Stay in ICU — The number of days per episode that a patient was under Intensive Care during a hospitalization
-
ICU Patient Ventilator Days — *The total number of days that mechanical ventilation-related charge items appear in a patient’s billing file
-
Return to ICU — A patient who had been transferred from an Intensive Care Unit to a regular ward, and then transferred back to an Intensive Care Unit during the same hospitalization (There has to be at least one day gap between two episodes)
-
Returns to ICU within 48 hours — A patient had subsequent ICU episodes within 48 hours of being transferred from the ICU during the same hospitalization
*Note: There are three ICD-10 procedure codes (5A1935Z, 5A1945Z, 5A1955Z) designated for mechanical ventilation. If a patient’s ICD data did not include one of these three procedure codes, the patient’s ventilator days will be set to zero even though mechanical ventilator-related billing items appear in the billing file. If a patient had more than one episode of ICU admission, ventilator days are calculated separately for each episode.
Please see ICU Risk Adjustment for more in-depth information. Going forward this page is available to link to from the new ICU Outcomes Comparison Help page and in Chapter 17 of the Methodologies Guide.
ICU Patient Level Metrics:
-
ICU Patient Mortality — ICU Patient Mortality is defined as patients who died during hospitalization, in which Intensive Care was the sole or part of care provider
-
Length of Stay in Hospital (ICU Patients) — The number of days that a patient stayed in hospital, including in ICU. Note: This is not a new metric, and it is based on current QualityAdvisor LOS calculations. But for the new analysis it is specific to the ICU patient population
-
Cases Directly Admitted to ICU — Total number of ICU patients that were admitted to ICU upon admission
-
LOS while in ICU — The total number of days that a patient was under Intensive Care during a hospitalization
Notes:
-
ICU outcomes (including on custom query) are only available for discharges 10/1/2021 and forward
-
ICU Metrics require a patient billing file. ICU patients are identified by ICU Room and Board billing items
-
ICU Patient are Inpatients 18 years of age and older, whose billing file includes at least one Room & Board billing item from an Intensive Care unit
-
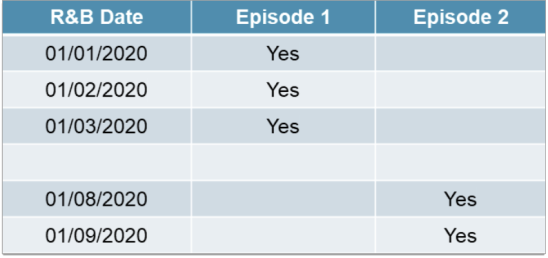
ICU patients can have multiple ICU episodes of care. If a patient’s ICU R&B dates are continuous, they are regarded as one episode of intensive care. If there is a gap between ICU R&B dates, the latter date is regarded as the beginning of a new episode of intensive care
-
If a patient’s last day of R&B billing is the same or one day before the final discharge date, the patient is regarded as being discharged from ICU
Custom Query Notes
-
In order to distinguish the newly created "ICU Risk Adjusted" folder in Custom Query from the existing "ICU Usage" folder, the existing folder is renamed as "ICU Usage (AE)"
-
The new ICU risk-adjusted outcomes are available within the new “ICU Risk Adjusted” folder
New ICU Outcomes Comparison Analysis
This risk-adjusted analysis provides members with benchmark information related to ICU metrics and ICU patients, to gain a better understanding of ICU LOS, Returns to the ICU, and ICU Mortality (both patients that died in the ICU, and patients that died after being in the ICU). You can use the new analysis to identify opportunities for improvement relative to peer performance.
Note: A billing file is required to be submitted for data to return on this report (facility and peer).
The report includes a combination of grid and graph visualizations across three tabs:
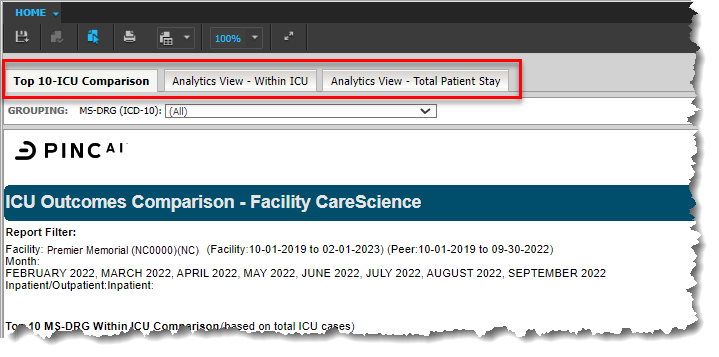
Top 10- ICU Comparison Tab
-
Includes a section that returns the Top 10 MS-DRGs by volume (based on total ICU cases calculated at the episode level) that resulted in an ICU stay
-
Includes Observed and O/E results for the newly added ICU risk-adjusted metrics
-
Includes a separate section that returns the Top 10 MS-DRGs that is looking at your ICU patients full hospital stay. These metrics are calculated at the patient level
-
Includes graphs for the "Top 10 MS-DRG Outcome Comparison" and "Mortality in ICU- Top 10 MS-DRG Standard Age by Race" Analytics View-Within ICU Tab
-
Includes full drill maps from the grid row header
Analytics View-Within ICU Tab
-
Includes all MS-DRGs and all ICU outcome metrics for the "Within ICU Comparison" grid
-
This view is calculated at the episode level
-
Includes full drill maps from the grid row header
-
Includes hyperlink to drill to the ICU Episode (facility version only)
Analytics View-Total Patient Stay Tab
-
Includes all MS-DRGs and all ICU outcome metrics for the "Total Patient Stay (ICU Patients)" grid
-
This view is calculated at the patient level.
-
Includes full drill maps from the grid row header
Notes:
-
Both Facility and Peer versions are available for CareScience risk methodologies
-
A 3M version is not available
-
The analysis is presented in a predefined format, meaning the rows and columns cannot be modified
-
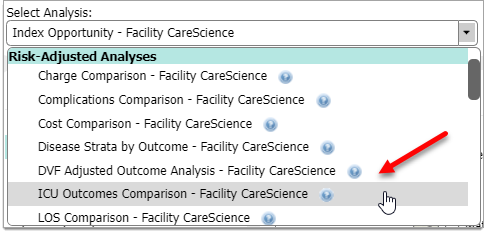
The new analysis is added to the Risk-Adjusted Analyses section on the Standard Analysis selection menu:
-
There is no Population Count button because this report is based on a subset of the total inpatient population and totals would not line up
-
As with other analyses, there is a 50,000 Row Limit. If a report returns more than 50,000 rows, an error message is displayed. You will then need to adjust your report criteria
-
ICU Episode drill is counted at the Episode level. Therefore, the count will not match ICU Cases
Differences in features and functionality between Custom Query and the ICU analysis
-
Custom Query does not have a date limitation since other outcomes are available for selection. If you select a timeframe prior to 10/1/2021, no ICU data will return on the Custom Query for that timeframe
-
Custom Query includes a subtotal line and the ICU report does not. The subtotal is just a sum of the rows on the Custom Query and should not be used the same way as with other risk-adjusted reports
-
On the Top 10 MS-DRG tab, it is possible for more than 10 MS-DRGS to display if multiple MS-DRGs have the same number of Total ICU Cases
Report details and sample screens are available to review by selecting either ICU Outcomes Comparison — Facility or ICU Outcomes Comparison — Peer.
With this release we have added the 2023 version (Version 12.0) of the CMS Hospital-Wide Readmission methodology and Planned Readmission Algorithm to QualityAdvisor's risk-adjusted reporting. The newly added methodology is called the CMS All-Cause Hospital-Wide (HWR) 30-Day Readmission based on Planned Readmission Algorithm (PRA) v4.0 2023. This methodology applies to patient discharges beginning October 1, 2019 and forward.
QualityAdvisor maintains two versions of CMS Readmission methodologies to allow you to choose when to move to the latest methodology. The current versions now include:
-
CMS All-Cause Hospital-Wide 30-Day Readmission (HWR) Methodology Based on PRA v4.0 2023 (discharges October 1, 2019 and forward)
-
CMS All-Cause Hospital-Wide 30-Day Readmission (HWR) Methodology Based on PRA v4.0 2022 (discharges October 1, 2019 and forward)
Note: The CMS All-Cause Hospital-Wide 30-Day Readmission (HWR) Methodology Based on PRA v4.0 2021 is removed with this release.
Summary Overview
The 2023 version of the Hospital-Wide Readmission methodology (HWR PRA v4.0 2023) is very similar to past versions. There are no flowchart or algorithm changes to the HWR methodology itself or the Planned Readmission Algorithm.
The following updates have been made to the HWR measure for Version 12.0 with the intent to maintain the clinical integrity of the algorithm and cohort definitions:
Changes to the surgery/gynecology cohort inclusion list:
-
The addition of singular ICD-10-PCS codes (associated with AHRQ CCS procedure category 49)
Changes to the planned readmission algorithm:
-
Potentially planned procedures:
The addition of ICD-10-PCS codes (associated with AHRQ CCS procedure categories 48 and 49) to the singular ICD-10-PCS code list. The singular ICD-10-PCS code list previously had ICD-10-PCS codes associated with both of these AHRQ CCS procedure categories
-
Acute diagnoses
The addition of ICD-10-CM codes (associated with AHRQ CCS diagnosis categories 155, 233, 238, 253, and 662) to the singular ICD-10-CM code lists. The singular ICD-10-CM code lists previously had ICD-10-CM codes associated with all of these AHRQ CCS diagnosis categories
The addition of AHRQ CCS diagnosis categories 237 (Complication of device; implant or graft) and 661 (Substance-related disorders) as whole categories (and removal of the previous subsets of ICD-10-CM codes that fell under these categories from the singular ICD-10-CM code lists)
-
The following COVID-19 modifications that were introduced with version 2022 will continue for this version of reporting:
A ‘History of COVID-19’ risk variable is incorporated into the risk-adjustment model
COVID-19 index admissions are excluded from the cohorts. COVID-19 index admissions are defined by a principal diagnosis code of COVID-19 or a secondary diagnosis code of COVID-19 coded as POA on the index admission claim
COVID-19 readmissions are not eligible for the readmission outcome and are excluded. COVID-19 readmissions are defined by a principal diagnosis code of COVID-19 or a secondary diagnosis code of COVID-19 coded as POA on the readmission claim
Notes
-
A new prompt option for the HWR PRA v4.0 2023 methodology has been added to all relevant analyses
-
All relevant analyses have been updated to include Readmission metrics based on the new HWR PRA v4.0 2023 methodology
Additional information is available in the Inpatient Methodologies Guide Chapter 7 - Readmissions >All-Cause Hospital-Wide 30-Day Readmission Methodology based on PRA v4.0 2023.
Updated population tables are available in PRA Version 4.0 2023 - Overview and Population Tables.
We have completed our annual calibration updates, which affect all of the CareScience and 3M™ Risk-Adjusted Outcomes: Cost, Charges, Length of Stay [LOS], Readmissions, Complications, and Mortality.
With the 2024 Calibration update, data is rescored for patient discharges from 10/1/2023 and forward for both CSA Inpatient and Outpatient Outcomes.
We have also updated to the APR DRG Grouper v41.0 for patient discharges beginning 10/1/2023 and forward.
-
Eight quarters of data, inclusive of 4Q2021-3Q2023 data, is used to calculate the 2024 calibration updates for both Inpatients and Outpatients
-
The 2024 scaling factors are applied to all CareScience outcomes for patient discharges beginning 10/1/2023 and forward, except for the Charge outcome (only Standard Practice expected values calculated for this outcome) and new HWR PRA v4.0 2023 outcome
-
The 2024 CSA Outpatient calibrations data is rescored from 10/1/2023 and forward for the following outcomes:
Same Day Surgery Returns to ED (within 1, 3, 7, 30 days) – 4 outcomes
Observation Returns to ED (within 1, 3, 7, 30 days) – 4 outcomes
ED Returns to ED (within 1, 3, 7, 30 days) – 4 outcomes
ED Returns and Admitted as Acute Inpatient (within 4-7 and 30 days) – 2 outcomes
Notes
-
Please review the Annual Calibration Updates for 2024 for detailed information
-
A Frequently Asked Questions document all about CSA Risk Adjustment Methodology is available in Chapter 3 of the Inpatient Methodologies Guide
- As a reminder, if a patient qualifies as an outcome case for length of stay, charges, or cost, there is logic used in the CareScience model to determine if the patient's calculated risk falls within the allowable range (trim point values or CSA outlier logic). Every year the minimum and maximum values are updated with new ranges to account for changes in care practice
-
The Data Vintage Factor Adjusted Outcome Analysis Facility and Peer reports are updated to account for both the annual 2024 calibration updates, and the CareScience Analytics model enhancements
-
Select Practice is not currently available for CSA OP risk-adjustment and will not be added with this year’s calibration release
2024 CareScience Analytics Model Enhancements
A new version of facility statistics has been created based on updated postal/zip code data which impacts distance, relative distance and income risk factors for each patient:
-
This facility statistics version is used for the 2024 model year and forward
-
Prior model years will continue to be calculated with the previous version of facility statistics and postal/zip code data on which they were calibrated
-
Facility statistics are only used for CSA inpatient and CSA-ICU risk-adjustment
Premier has refreshed the outlier minimum and maximum values using calendar year 2022 data. Prior to this release, the boundary values were based on calendar year 2021 data.
The impact to the number of outliers in the database is minimal, shifting from 10.25% of inpatients currently as outliers to 12.37% of inpatients as outliers as a result of the change.
Refer to the Outlier Prompt Methodology for more information.
Notes
- The Outlier updates will also be available in CPM Hospital and Quality Console once the profile definitions and dashboards have been reprocessed with a data release.
The Facility Profiling Analysis now reflects metrics based on data from CMS FY2023 (October 1, 2022 to September 30, 2023).
The DVF Adjusted Outcome Analysis provides an automated solution for users who would like to stabilize trended reporting across one or more calibration cycles. This analysis allows you to analyze trends from year to year while holding the benchmark at the fixed baseline. All CSA 2024 Model Year changes are incorporated into each version of the DVF Adjusted Outcome Analyses (Facility & Peer, CareScience & 3M).
Notes
-
The new HWR PRA v4.0 2023 Readmission methodology will not be added to the report this year, since there is no DVF needed, and that outcome is available within other reporting options
-
The HWR PRA v4.0 2022 Readmission methodology is added to the report this year
-
The HWR PRA v4.0 2021 Readmission methodology is retired
The Disease Strata by Outcome analysis was introduced to QualityAdvisor in October 2022, following the CSA 2022 move to CCSR disease strata. With this August 2024 release, the analysis is updated with the new CSA 2024 calibrations.
Notes
-
The CSA 2024 version replaces the CSA 2023 version for this analysis
-
Readmissions metrics now include both HWR Methodology Based on PRA v4.0 2023 and PRA v4 2022
-
Readmission metrics based on HWR PRA v4 2021 are removed
With this release, we updated the Risk Calculator to factor in all relevant aspects of this August 2024 release, including:
-
All CSA 2024 Risk Model year updates
-
All calibration updates
-
The addition of the new All-Cause HWR PRA v.4.0 2023 Readmission methodology
Notes
-
A new tab has been added for the new All-Cause HWR PRA v.4.0 2023 Readmission methodology
-
HWR PRA v4.0 2021 Readmission methodology has been retired from the Risk Calculator
-
With the addition of the new CSA 2024 model year, the oldest model year (CSA 2021) has been rolled off of the calculator
With this release, Premier has completed the annual archiving of data from the QualityAdvisor database.
With last year’s Calibration release, Premier altered the archiving schedule due to PSI-90 for CMS HACRP reporting availability and overlap with the performance period. This year's archiving includes the remainder of FY18 (July 1, 2018 - September 30, 2018) and all of FY19 (October 1, 2018 - September 30, 2019).
Additionally, v11 CMS PSI-90 for HACRP FY2022 is now fully retired.