Report Objects
Each analysis has objects that appear in the grid by default and objects that are retrieved when the analysis is run but appear in Report Objects by default. These objects can be additional metrics, calculations, or information specific to the population.
For example, on the risk-adjusted analyses, 3M™ analyses display arithmetic values in the grid by default. The geometric values are pulled when the analysis is run but appear in Report Objects to be added later, if desired.
Accessing Report Objects
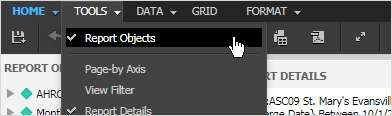
Click on Tools in the report toolbar and then select Report Objects.
The analysis Objects panel opens to the left of the grid displaying a list of objects you can add.
For example:
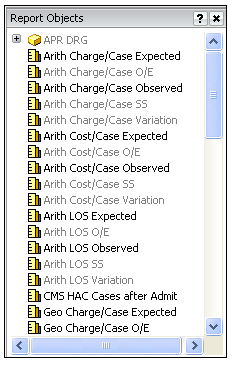
Objects already in the grid are grayed-out. Objects that are grayed-out cannot be added to analyses.
Adding Objects to Analyses
Select a metric in the list, drag and drop it on the grid, and wait as the view refreshes. Because all metrics are calculated when the analysis is run, you do not have to wait for the system to calculate the metrics when you drag and drop.
Note: You can add multiple objects to an analysis at a time using the CTRL + click method.
Removing Objects from Analyses
Select the column heading and drag and drop it in the analysis Objects panel. The column is removed and the metric appears as an active object in Report Objects.
- You can remove only one object at a time.
- You cannot remove multi-value attributes from grids.
Splitting Rows into Attribute Forms
The Row Headers you select on the Set Up Analysis tab often have two forms: an ID and a Description, for example. You can use Report Objects to show only one form on the grid.
For example, if you selected Attending Practitioner as the Row Header, you can use Report Objects to partially blind practitioners' identities by removing their names from the rows, leaving only the ID or the Code.
Using Attending Practitioner as the Row Header Attribute
- On the grid, select the column heading of the Row Header (in this case, Attending Practitioner) and drag it over to the analysis Objects panel.
- The Row Header is removed from the grid.
- In the analysis Objects panel, click the
 to the left of the Row Header item to expand it.
 - Select ID or Code and drag it back to the grid.
- A column for the Row Header item (in this case, Attending Practitioner) appears on the grid with only the ID or Code displaying in the column.
Note:It might be faster to click the Data toolbar >  (Toggle Attribute Form Names). This splits the Row Header attribute so that there's a column for each form (Attending Practitioner Name and Attending Practitioner Code, for example). Then, select the column header of the form and drag it over to Report Objects to remove it from the grid.