Disease Strata by Outcome - Facility CareScience
Use this analysis to see risk-adjusted outcomes by AHRQ Clinical Classification Software Refined (CCSR) categories.
The analysis is designed so you can easily evaluate CareScience Analytics (CSA) risk-adjusted outcomes by CCSR for defined populations, and identify the CCSRs which have opportunity for improvement for each outcome.
Tip! You can use this report together with the Risk Calculator for deeper analysis of opportunities, and to improve documentation and coding for CCSR groupings going forward. Review the Suggested Use Case below for details.
|
There are 3 required prompts that you must select before running this analysis. Required Prompts:
Notes: The Time prompt allows either a Basic or Advanced time selection: With the Basic option you can choose 1, 3, or 6 months, 1 year, or a customized date range. However, be aware that the report only returns data beginning October 1, 2023 through the current publish date. Selecting dates outside of this range will result in no data returned on the analysis. Using the Advanced option you can choose a CSA Model Year, or a specific month, quarter, or year. However, dates prior to 10/1/2024 are not available to select. The report only returns data beginning October 1, 2024 through the current publish date, until future CSA years are added. The CSA Model Year prompt defaults to CSA 2025 (October 1, 2024 - current publish date) until future CSA model years are added. Optional Prompts:
|
Clinical Classification Software Refined (CCSR)
The Agency for Healthcare Research and Quality (AHRQ) has released an ICD-10 based classification software – Clinical Classification Software Refined (CCSR).
With the 2022 Calibration Release in QualityAdvisor, CareScience Analytics (CSA) transitioned from ICD-9 based AHRQ Clinical Classification Software (CCS) categories to ICD-10 based AHRQ Clinical Classification Software Refined (CCSR) Categories. The incorporation of CCSRs in the stratification process allows Premier to improve the CSA risk-adjustment by creating more specific disease groups. Additionally, incorporating CCSRs in the comorbidities supports the creation of more specific assignments of risk to patients and improve the CSA risk-adjustment model.
CCSRs are used to group patients to understand what variables are included and how they are weighted for the CSA risk-adjustment model, similar to patient APR DRG groupings within the 3M risk methodology.
The current listing of Disease Strata is available in Chapter 3 of the Methodology Guide.
Default Metrics
The following metrics appear in the grid when the analysis returns:
-
Disease Stratum
-
Metric Name
-
Total Cases
-
Mortality Outcome, including:
-
Outcome Cases
-
Observed
-
Expected
-
O/E
-
Statistical Significance
-
-
Readmissions (HWR 2024) Outcome including:
-
Outcome Cases
-
Observed
-
Expected
-
O/E
-
Statistical Significance
-
-
Complications Outcome, including:
-
Outcome Cases
-
Observed
-
Expected
-
O/E
-
Statistical Significance
-
-
Length of Stay, including:
-
Outcome Cases
-
Geo Observed
-
Geo Expected
-
Geo O/E
-
Geo Statistical Significance
-
-
Cost per Case Outcome, including:
-
Outcome Cases
-
Geo Observed
-
Geo Expected
-
Geo O/E
-
Geo Statistical Significance
-
You are able to toggle between Standard and Select versions of the analysis.
Analysis Sample
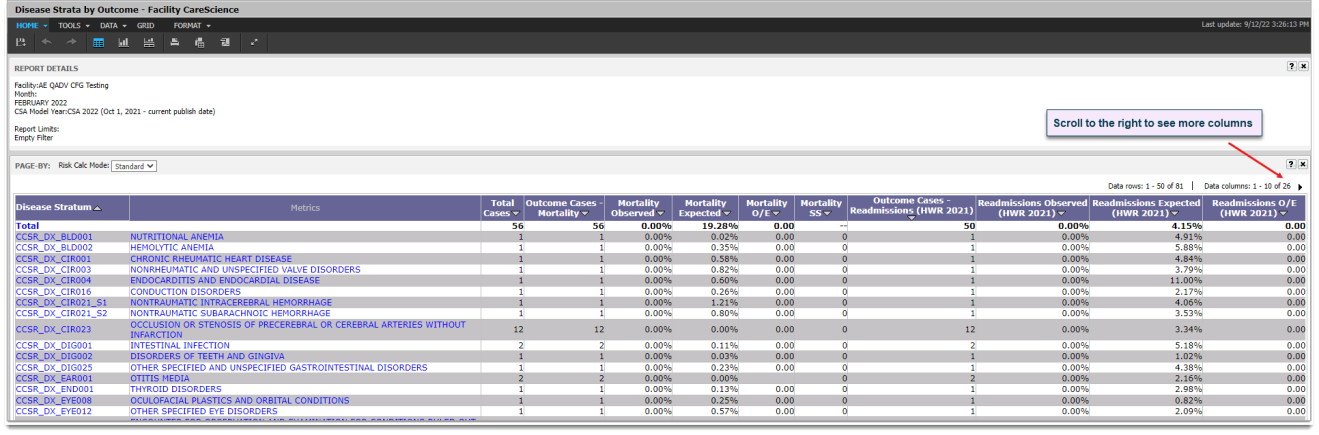
Metrics in Report Objects
Each analysis has objects that appear in the grid by default and objects that are retrieved when the analysis is run but appear in Report Objects by default. These objects can be additional metrics, calculations, or information specific to the population.
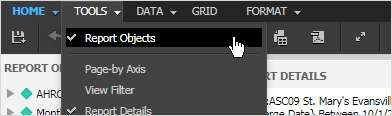
Click on Tools in the report toolbar and then select Report Objects.
Then drag-and-drop metrics from the available list onto the grid for this analysis. Metrics available include:
-
CMS HAC Cases after Admit
-
Outcome Cases - Charge/Case
-
Geo Charge/Case Observed
-
Geo Charge/Case Expected - CS Std
-
Geo Charge/Case Variation - CS Std
-
Geo Charge/Case O/E - CS Std
-
Geo Charge/Case O/E SS - CS Std
-
Opportunity (Geo Charge) - CS Std
-
Arith Charge/Case Expected - CS Std
-
Arith Charge/Case O/E - CS Std
-
Arith Charge/Case Observed - CS Std
-
Arith Charge/Case SS - CS Std
-
Arith Charge/Case Variation - CS Std
-
Opportunity (Arith Charge) - CS Std
-
Total Charges for Outcome Cases
-
Complication Variation - CS Std
-
Geo Cost/Case Variation - CS Std
-
Opportunity (Geo Cost) - CS Std
-
Arith Cost/Case Expected - CS Std
-
Arith Cost/Case O/E - CS Std
-
Arith Cost/Case Observed
-
Arith Cost/Case SS - CS Std
-
Arith Variation - CS Std
-
Opportunity (Arith Cost) - CS Std
-
Total Costs for Outcome Cases
-
Geo LOS Variation - CS Std
-
Opportunity (Arith LOS)
-
Opportunity (Geo LOS)
-
Arith LOS Expected - CS Std
-
Arith LOS O/E - CS Std
-
Arith LOS Observed - CS Std
-
Arith LOS SS - CS Std
-
Arith LOS Variation - CS Std
-
Total Days
-
Total Days for Outcome Cases
-
Total Deaths for Outcome Cases
-
Mortality Variation - CS Std
-
Opportunity (Mortality)
-
Total Deaths
-
Average Days Between Admissions
-
Outcome Cases - Readmissions (HWR 2023)
-
Outcome Cases with Readmissions (HWR 2023)
-
Readmissions Observed (HWR 2023)
-
Opportunity (Readmissions) - (HWR 2023)
-
Readmissions Expected - CS Std (HWR 2023)
-
Readmissions Variation - CS Std (HWR 2023)
-
Readmissions O/E - CS Std (HWR 2023)
-
Readmissions SS - CS Std (HWR 2023)
-
Cases with Readmissions (HWR 2023)
-
Outcome Cases with Readmissions (HWR 2024)
-
Opportunity (Readmissions) - (HWR 2024)
-
Readmissions Variation - CS Std (HWR 2024)
-
Cases with Readmissions (HWR 2024)
-
Outcome Cases - Readmissions (All IP)
-
Outcome Cases with Readmissions (All IP)
-
Readmissions Observed (All IP)
-
Opportunity (Readmissions) - (All IP)
-
Readmissions Expected - CS Std (All IP)
-
Readmissions Variation - CS Std (All IP)
-
Readmissions O/E - CS Std (All IP)
-
Readmissions SS - CS Std (All IP)
-
Cases with Readmissions (All IP)
Suggested Use Case
You can use this report together with the Risk Calculator for deeper analysis of opportunities, and to improve documentation and coding for CCSR groupings going forward. The following is an example of how to use this analysis with the Risk Calculator.
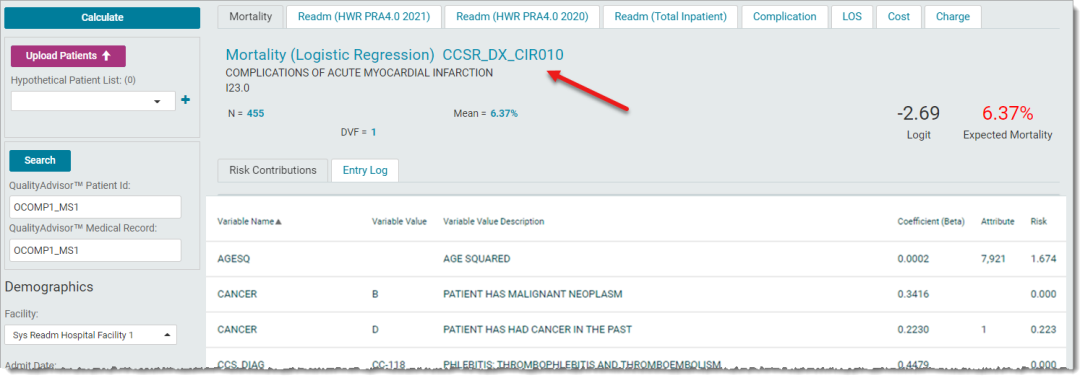
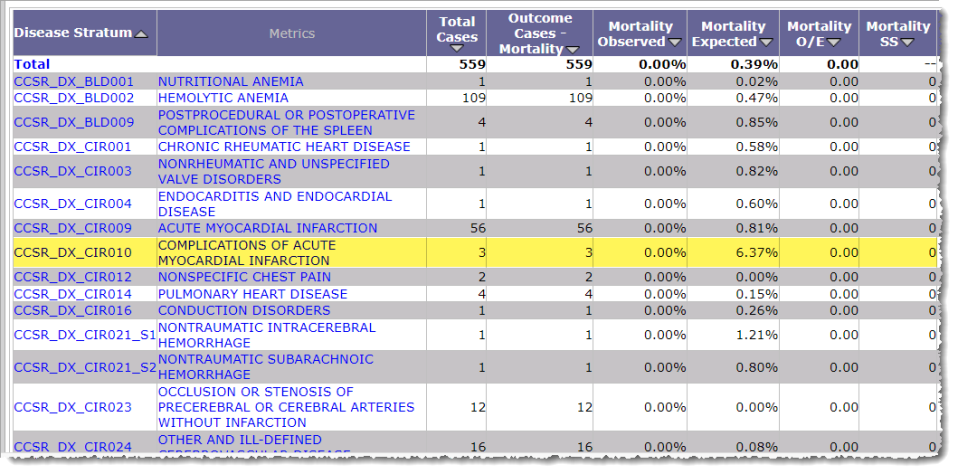
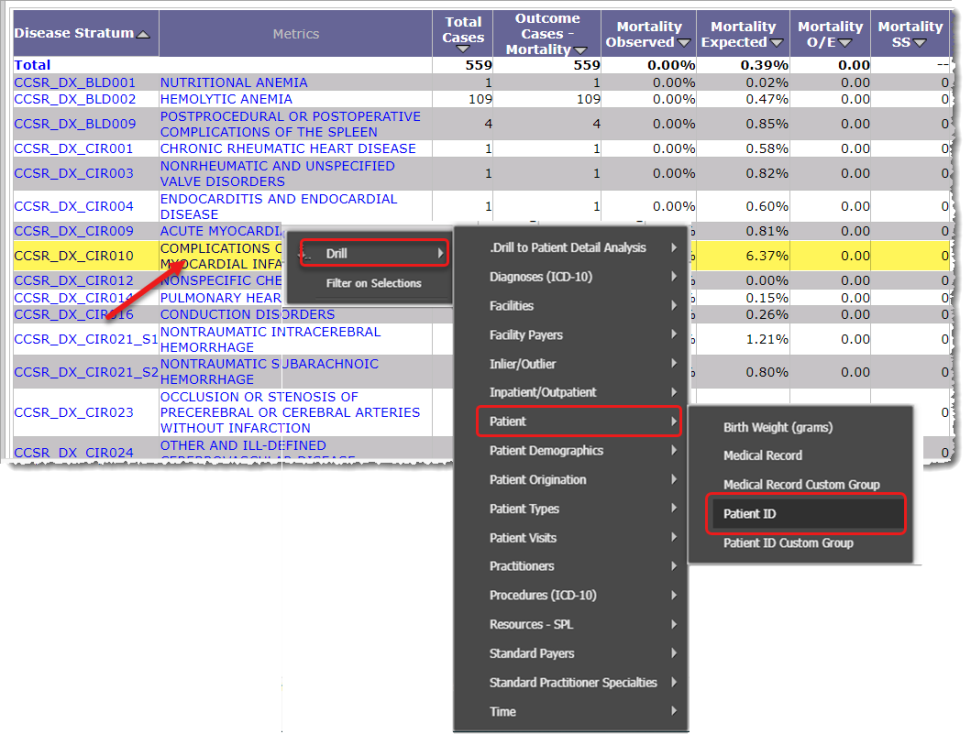
This example uses the Mortality outcome to a look at CCRS_DX_CIR010 Complications of Acute Myocardial Infarction:
To use the Risk Calculator to for deeper analysis of any outcome, you need the Patient IDs to search for specific patients in the calculator.
Drill down to the Patient IDs for this CCSR by "right clicking" with your mouse on the metric. Then select Drill > Patient > Patient ID:
Next, go to the Risk Calculator and use the Facility and Patient IDs to search for a patient in the CCSR. (Refer to the Risk Calculator Workflow for detailed information.)
Once a patient is found, the calculator shows you all the variables and variable weightings that go into the expected value calculation for the CCSR group. This deeper level of analysis will help to improve documentation and coding for CCSR groupings.