System 30-Day Readmission - Facility CareScience
This analysis allows you to track the observed readmission rate based on system-wide data and learn where a readmission occurred. You can drill to the patient details for the readmissions that occurred in the facility or facilities that you have access to within QualityAdvisor. If a patient was readmitted to a facility in your health system that you do not have access to, you will be able to see where the readmission occurred; however, patient details will not be available for that readmission, since you do not have access to that facility in QualityAdvisor.
The standard functionality (for example, Saved Selections, Favorites) operates as it does in all other existing analyses.
In addition, this analysis also includes:
- The ability to select Index Visit facility(ies)
- The ability to drill to both Same Facility and System attributes and see these metrics side by side
Select Population Tab:There are 4 required prompts that you must select before running this analysis. Required Prompts:
- All-Cause Hospital-Wide 30-Day Readmission Methodology with Planned Readmission Algorithm v4.0 2024 (discharges 10/1/2020 and forward) - All-Cause Hospital-Wide 30-Day Readmission Methodology with Planned Readmission Algorithm v4.0 2023 (discharges 10/1/2020 and forward) - All-Cause 30-Day Readmission Methodology for All Inpatients (discharges 10/1/2020 and forward) Optional Prompts:
Set Up Analysis Tab:Page-By
Note: If you choose to put an item in the Page-By, there will be two dropdown lists in the Page-By: the one you choose here and the one for Standard and Select Practice. Note: The Row Header prompt is not available because each row is an MS-DRG Business Line with opportunity. |
Identifying Same Patient with MRN and Birth Date
To track a patient's readmissions across a health system, QualityAdvisor confirms the following attributes to determine same patient status:
- Same Health System
- Same Medical Record Number (MRN)
- Same Birth Date
Index Visit
The readmissions process starts with identifying the eligible index admissions and readmissions. Index admissions and readmissions are defined by how the admissions relate to each other within the parameters selected at the prompts (such as Facilities and Time).
Note: For patients transferred between hospitals, the measure considers multiple hospitalizations that result from hospital-to-hospital transfers as a single acute episode of care. Admissions to a hospital within one day of discharge from another hospital are considered transfers regardless of whether the first institution indicates intent to transfer the patient in the discharge disposition code or whether the second inpatient admission is for the same condition. For patients transferred from one short-term acute care hospital to another, only the last admission in the series of transfers is eligible for inclusion in the cohort. The previous admissions are not included.
In the following example of Patient A for the month of June 2024, the index admissions are identified:
|
Patient |
Admission Date |
Discharge Date |
Admission Type |
|---|---|---|---|
|
Patient A |
6/2/24 |
6/4/24 |
Index |
|
Patient A |
6/10/24 |
6/15/24 |
Readmission/Index* |
|
Patient A |
6/20/24 |
6/26/24 |
Readmission/Index* |
|
Patient A |
6/30/24 |
7/7/24 |
Readmission (patient expired) |
In the following example of Patient B for the month of June 2024 with same day transfer within health system, the index admissions are identified:
| Hospital |
Patient |
Admission Date |
Discharge Date |
Admission Type |
|---|---|---|---|---|
| Hospital A |
Patient B |
6/2/24 |
6/4/24 |
N/A – not eligible for index |
| Hospital B |
Patient B |
6/4/24 |
6/15/24 |
Index |
| Hospital B |
Patient B |
6/20/24 |
6/26/24 |
Readmission |
Calculating System Readmissions Rate
System Readmission Rate is calculated by looking at the number of readmissions to any facility within the health system regardless of access. Only facilities to which you have access can be selected to indicate where the index visit occurred.
- Numerator - The numerator is the # of readmissions based on the readmissions across all facilities within the system.
- Denominator -
The denominator is the index visits for the facility or facilities selected.
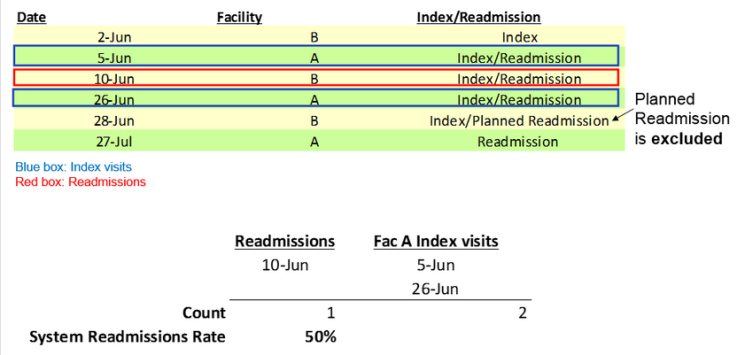
In the example below, the logic uses the CSA Risk-adjusted 30-Day Readmission methodology, except expanding the denominator cases to be the outcome cases across all the selected facilities within the system. Planned readmissions are excluded, and the logic looks forward 30 days from each index visit.
Examples
You have access to Facility A only
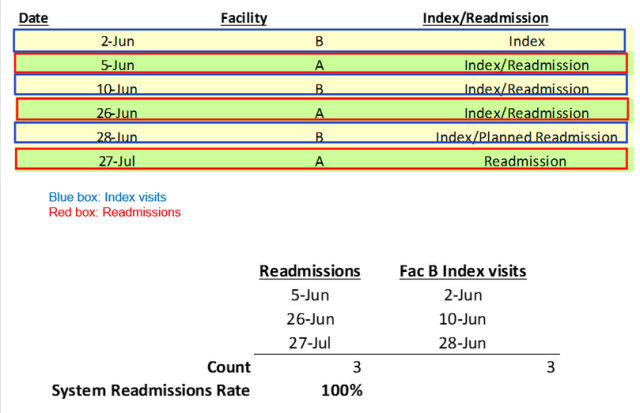
You have access to Facility B only
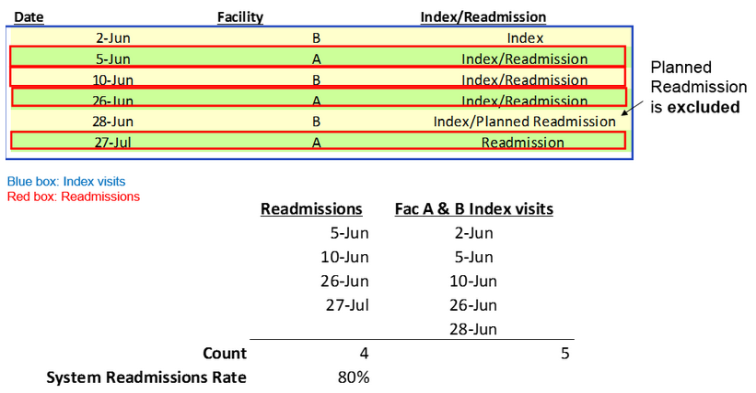
You have access to both Facility A and B
Sample Analysis
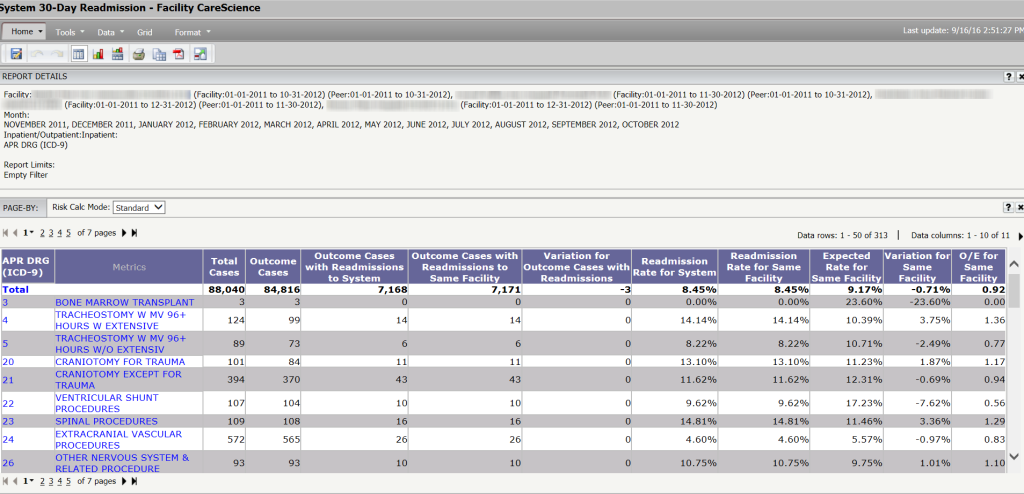
System Metrics
The following metrics are available in this analysis. Note that the Same Facility metrics are the metrics that are available in the Risk-adjusted 30-day Readmission -Facility CareScience analysis. They have been renamed with Same Facility in the description to differentiate between the system metrics:
- Total Cases
- Outcome Cases
- Outcome Cases w/Readmissions to System
- Outcome Cases w/Readmissions to Same Facility
- Variation for Outcome Cases w/Readmissions
- Readmission Rate for System
- Readmission Rate for Same Facility
- Expected Rate for Same Facility
- Variation for Same Facility
- O/E for Same Facility
Analyzing Column Data
This analysis has two specific readmission columns:
- Outcome Cases with Readmissions to System
- Outcome Cases with Readmissions to Same Facility
These two columns should be taken as two separate columns and should not be compared.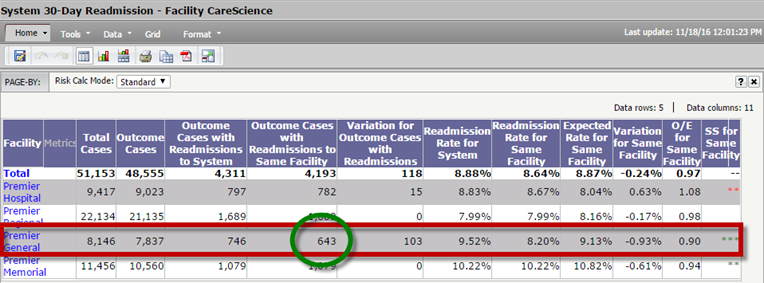
For the Outcome Cases with Readmissions to System column only, you can see what facilities in the system the patients were readmitted to even if you do not have access to those other facilities. These numbers may not match up with the Outcome Cases with Readmissions to the Same Facility.Hence, you cannot compare both analyses together.
Metrics in Report Objects
Report Objects allows you to add metrics to the grid. Click the  button in the Tools toolbar to see the metrics in Report Objects.
Patient Detail Drilldown
You can drill to both Same Facility and System Patient Details Analysis.
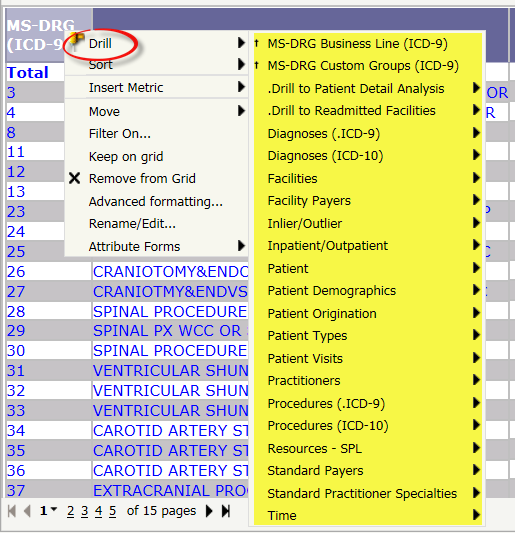
All existing drill options are available in this analysis; however, Drill to Readmitted Facilities has been added to show you the number of readmissions and the readmission rate to all facilities within a system.
To access any drilldown, right-click on the column header or the rows and select Drill > Applicable Attribute > Applicable Sub-Attribute (where necessary).
Note that the System 30-Day Readmission analysis is based on the index facilities, whereas the Drill to Readmitted Facilities is only the list of facilities where readmissions occurred. As a result, the values may differ when drilling from the analysis to the readmitted facility list.