LOS Comparison - Facility 3M™
This analysis enables you to evaluate the LOS outcomes for a defined population. Use this analysis to identify opportunities for improvement.
Select Population Tab:There are 3 required prompts that you must select before running this analysis. Required Prompts:
Optional Prompts:
Set Up Analysis Tab:Row Header Prompt
|
Default Metrics
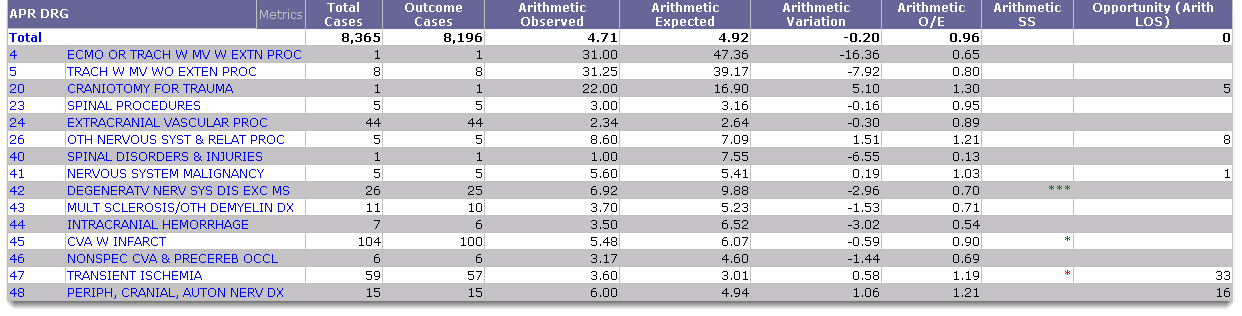
The following metrics appear in the grid when the analysis returns:
- Total Cases: All cases that qualified for the analysis.
- Outcome Cases: The number of cases for the LOS outcome that qualified for risk adjustment. Based on the Outcome Case methodology, some cases may not qualify for risk adjustment.
- Arithmetic Observed: The arithmetic mean length of stay LOS for the LOS Outcome Cases.
- Arithmetic Expected: The expected value for the Outcome Cases, calculated using the 3M™ risk-adjustment methodology and the arithmetic mean.
- Arithmetic O/E: The Observed value divided by the Expected value. Less than 1 = performing better than expected. Greater than 1 = performing worse than expected.
- Arithmetic Variation: The Observed value minus the Expected value.
- Arithmetic SS: Asterisks display only if the Variation is statistically significant. The number of asterisks indicates the confidence level that the outcome's variation is not due to chance: 1 asterisk = 75%, 2 asterisks = 95%, 3 asterisks = 99%. Green asterisks = the outcome’s variance is statistically better than expected. Red asterisks = the outcome’s variance is statistically worse than expected. Total lines do not have values for Statistical Significance.
- Opportunity (Arith LOS): Variation multiplied by the LOS Outcome Cases. There must be at least one opportunity day for a value to display. Opportunity days are rounded to the nearest whole number.
Metrics in Report Objects
Report Objects allows you to add metrics to the grid. Click the  button in the Tools toolbar to see the metrics in Report Objects. You can drag-and-drop the following metrics on the grid for this analysis:
- CMS HAC Cases After Admit - The number of patients with at least one CMS Hospital Acquired Condition (HAC) after admission.
- Geometric Expected: The expected value for the Outcome Cases, calculated using the 3M™ risk-adjustment methodology and the geometric mean.
- Geometric Observed:The geometric mean length of stay (LOS) for the LOS Outcome Cases.
- Geometric O/E: The Observed value divided by the Expected value. Less than 1 = performing better than expected. Greater than 1 = performing worse than expected.
- Geometric Variation:The Observed value minus the Expected value.
- Geometric SS: Asterisks display only if the Variation is statistically significant. The number of asterisks indicates the confidence level that the outcome's variation is not due to chance: 1 asterisk = 75%, 2 asterisks = 95%, 3 asterisks = 99%. Green asterisks = the outcome’s variance is statistically better than expected. Red asterisks = the outcome’s variance is statistically worse than expected. Total lines do not have values for Statistical Significance.
- Opportunity (Geo LOS): Variation multiplied by the LOS Outcome Cases. There must be at least one opportunity day for a value to display. Opportunity days are rounded to the nearest whole number.
- Total Days: The total number of days for the LOS Total Cases.
- Total Days for ALOS Outcome Cases: The total number of days for the LOS Outcome Cases.
For more information, see Metrics on the Risk-Adjusted Analyses.
Analysis Sample
Drilling to Patient Details
Facility All Patient Detail Analysis
This analysis allows you to drill to the Facility All Patient Detail Analysis, which includes all the patients that match the criteria entered at the prompts.
To access this drilldown, right-click on the column header or the rows and select Drill > Drill to Patient Detail Analysis > Facility All Patient Detail Analysis.
For more details, see Facility All Patient Detail Analysis.