Complications Comparison - Peer CareScience
This analysis allows you to evaluate the detailed Complications outcomes for a defined population. Use this analysis to identify opportunities for improvement.
CareScience Analytics Standard Practice is always the risk-adjustment methodology used to calculate the risk-adjusted metrics.
Fiscal Year Versioning (PIC and HAC)
This report utilizes the appropriate fiscal year version for Potential Inpatient Complications (PIC) based on the timeframe selected for the report.
For example:
-
Patients discharged from 10/1/2019 to 9/30/2020 group to the FY2020 PIC list
-
Patients discharged from 10/1/2020 to 9/30/2021 group to the FY2021 PIC list
-
Patients discharged from 10/1/2021 to 9/30/2022 group to the FY2022 PIC list
-
Patients discharged from 10/1/2022 to 9/30/2023 group to the FY2023 PIC list
-
Patients discharged from 10/1/2023 to 90/30/2024 group to the FY2024 PIC list
-
Patients discharged from 10/1/2024 and forward group to the FY2025 PIC list
-
Reports run for time periods that cross over multiple fiscal years (i.e., 10/1/2019, 10/1/2020, 10/1/2021, 10/1/2022, 10/1/2023, and/or 10/1/2024) will see a mix of the different PIC FY versions.
The methodology applied for CMS Hospital Acquired Conditions also utilizes the appropriate fiscal year versions for HACs.
For example:
-
Patients discharged from 10/1/2019 to 9/30/2020 group to the FY2020 CMS HAC list
-
Patients discharged from 10/1/2020 to 9/30/2021 group to the FY2021 CMS HAC list
-
Patients discharged from 10/1/2021 to 9/30/2022 group to the FY2022 CMS HAC list
-
Patients discharged from 10/1/2022 to 9/30/2023 group to the FY2023 CMS HAC list
-
Patients discharged from 10/1/2023 to 90/30/2024 group to the FY2024 CMS HAC list
-
Patients discharged from 10/1/2024 and forward group to the FY2025 CMS HAC list
Please see Chapter 8 of the Methodologies Guide for more information and to see the detailed Potential Inpatient Complication, and CMS Hospital Acquired Condition lists.
Select Population Tab:There are 4 required prompts that you must select before running this analysis. Required Prompts:
Optional Prompts:
Set Up Analysis Tab:Row Header Prompt
|
Default Metrics
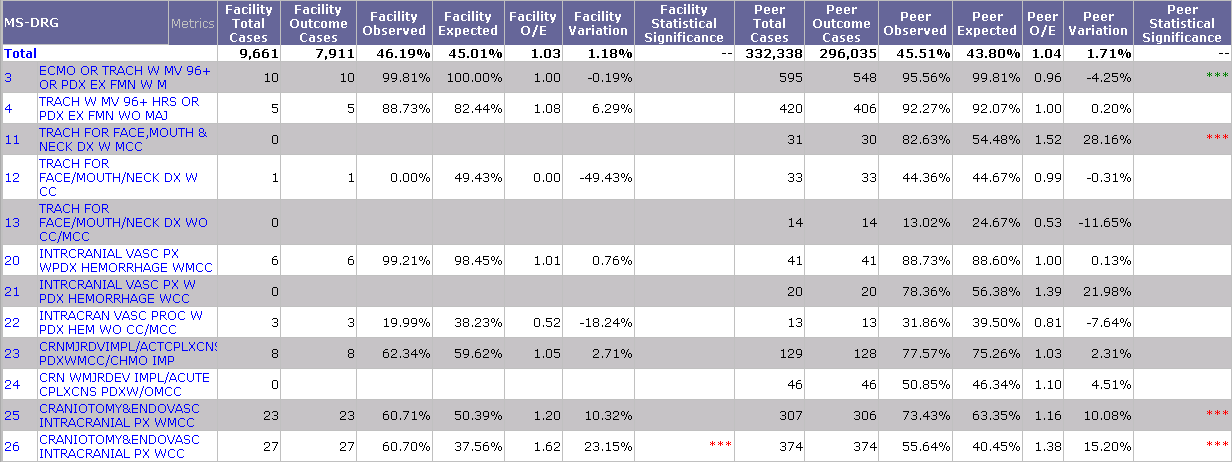
The following metrics appear in the grid when the analysis returns:
- Facility Outcome Cases - The number of cases for the Complications outcome that qualified for risk adjustment. Based on the Outcome Case methodology, some cases may not qualify for risk adjustment.
- Facility Observed - The Observed value is the complication rate. This value is calculated as the number of cases who had at least one complication divided by the total cases. Note that this calculation uses complication outcome cases.
- Facility Expected - The Expected value is the expected complication rate. This value is always calculated with CareScience Analytics Standard Practice.
- Facility Variation - The Observed value minus the Expected value.
- Facility O/E - The Observed value divided by the Expected value. Less than 1 = performing better than expected. Greater than 1 = performing worse than expected.
- Facility SS - Asterisks display only if the Variation is statistically significant. The number of asterisks indicates the confidence level that the outcome's variation is not due to chance: 1 asterisk = 75%, 2 asterisks = 95%, 3 asterisks = 99%. Green asterisks = the outcome’s variance is statistically better than expected. Red asterisks = the outcome’s variance is statistically worse than expected. Total lines do not have values for Statistical Significance.
The following metrics represent the aggregated data for the selections at the Peer prompt:
- Peer Outcome Cases - The number of cases for the Complications outcome that qualified for risk adjustment. Based on the Outcome Case methodology, some cases may not qualify for risk adjustment.
- Peer Observed - The Observed value is the complication rate. This value is calculated as the number of cases who had at least one complication divided by the total cases. Note that this calculation uses complication outcome cases.
- Peer Expected - The Expected value is the expected complication rate. This value is always calculated with CareScience Analytics Standard Practice.
- Peer Variation - The Observed value minus the Expected value.
- Peer O/E - The Observed value divided by the Expected value. Less than 1 = performing better than expected. Greater than 1 = performing worse than expected.
- Peer SS - Asterisks display only if the Variation is statistically significant. The number of asterisks indicates the confidence level that the outcome's variation is not due to chance: 1 asterisk = 75%, 2 asterisks = 95%, 3 asterisks = 99%. Green asterisks = the outcome’s variance is statistically better than expected. Red asterisks = the outcome’s variance is statistically worse than expected. Total lines do not have values for Statistical Significance.
For more information, see Metrics on the Risk-Adjusted Analyses.
Metrics in Report Objects
Each analysis has objects that appear in the grid by default and objects that are retrieved when the analysis is run but appear in Report Objects by default. These objects can be additional metrics, calculations, or information specific to the population.
Click on Tools in the report toolbar and then select Report Objects.
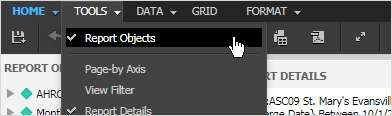
Then drag-and-drop metrics from the available list onto the grid for this analysis. Metrics available include:
- Facility Total Cases - All cases that qualified for the analysis.
- Facility CMS HAC Cases After Admit - The number of patients with at least one CMS Hospital Acquired Condition (HAC) after admission.
- Peer Total Cases - All cases that qualified for the analysis.
- Peer CMS HAC Cases After Admit - The number of patients with at least one CMS Hospital Acquired Condition (HAC) after admission.
For more information, see Metrics on the Risk-Adjusted Analyses.
Analysis Sample
Drilling to Patient Details
Facility All Patient Detail Analysis
Note: Only patients for the facilities selected at the Facilities prompt are included in patient detail drilldown analyses.
This analysis allows you to drill to the Facility All Patient Detail Analysis, which includes all the patients that match the criteria entered at the prompts.
To access this drilldown, right-click on the column header or the rows and select Drill > Drill to Patient Detail Analysis > Facility All Patient Detail Analysis.
For more details, see Facility All Patient Detail Analysis.