Outcome Profile - Facility CareScience
This analysis allows you to evaluate all outcomes for a defined population, which helps narrow the search for an opportunity for improvement. Use this analysis to see all the metrics for all the outcomes at-a-glance.
Select Population Tab:There are 3 required prompts that you must select before running this analysis. Required Prompts:
Optional Prompts:
Set Up Analysis Tab:Page-By
Note: If you choose to put an item in the Page-By, there will be two dropdown lists in the Page-By: the one you choose here and the one for Standard and Select Practice. Note: The Row Header prompt is not available because each row is an MS-DRG Business Line with opportunity. |
Expected Values on CareScience Analyses
CareScience analyses have two risk-calculation modes for the Expected value: Standard Practice and Select Practice. Standard Practice is the default, but you can change modes in the Page-By. Because the selected risk-calculation mode determines the Expected value, when you change modes, all the metrics based on the Expected value change as well. For more information, see Standard and Select Practice.
Note: Expected values for the Charge outcome are calculated only for Standard Practice.
Default Metrics
On this analysis, each row is an outcome: Mortality, Cost, Charge, LOS, etc. The following metrics return for each outcome when the grid returns:
Mortality:
- Outcome Cases - The number of cases for the Mortality outcome that qualified for risk adjustment. Based on the Outcome Case methodology, some cases may not qualify for risk adjustment.
- Observed -The number of patient deaths in the Mortality Outcome Cases.
- Expected - The expected value for the Outcome Cases, calculated using the CareScience Analytics risk-adjustment methodology.
- Variation - The Observed value minus the Expected value.
- O/E - The Observed value divided by the Expected value. Less than 1 = performing better than expected. Greater than 1 = performing worse than expected.
- SS - Asterisks display only if the Variation is statistically significant. The number of asterisks indicates the confidence level that the outcome's variation is not due to chance: 1 asterisk = 75%, 2 asterisks = 95%, 3 asterisks = 99%. Green asterisks = the outcome’s variance is statistically better than expected. Red asterisks = the outcome’s variance is statistically worse than expected. Total lines do not have values for Statistical Significance.
Complications:
- Outcome Cases - The number of cases for the Complications outcome that qualified for risk adjustment. Based on the Outcome Case methodology, some cases may not qualify for risk adjustment.
- Observed - The Observed value is the complication rate. This value is calculated as the number of cases who had at least one complication divided by the total cases. Note that this calculation uses complication outcome cases.
- Expected - The Expected value is the expected complication rate. This value is always calculated with CareScience Analytics Standard Practice.
- Variation - The Observed value minus the Expected value.
- O/E - The Observed value divided by the Expected value. Less than 1 = performing better than expected. Greater than 1 = performing worse than expected.
- SS - Asterisks display only if the Variation is statistically significant. The number of asterisks indicates the confidence level that the outcome's variation is not due to chance: 1 asterisk = 75%, 2 asterisks = 95%, 3 asterisks = 99%. Green asterisks = the outcome’s variance is statistically better than expected. Red asterisks = the outcome’s variance is statistically worse than expected. Total lines do not have values for Statistical Significance.
All-Cause Hospital-Wide 30-Day Readmissions based on PRA 4.0 2024
-
Outcome Cases - The number of inpatient index admissions that qualified for risk adjustment. Based on the Outcome Case methodology, some cases may not qualify for risk adjustment.
-
Observed - The Observed value is the observed readmission rate based on the outcome cases.
-
Expected - The Expected value is the expected readmission rate, calculated using the CareScience Analytics risk-adjustment methodology.
-
Variation - The Observed value minus the Expected value.
-
O/E - The Observed value divided by the Expected value. Less than 1 = performing better than expected. Greater than 1 = performing worse than expected.
-
SS - Asterisks display only if the Variation is statistically significant. The number of asterisks indicates the confidence level that the outcome's variation is not due to chance: 1 asterisk = 75%, 2 asterisks = 95%, 3 asterisks = 99%. Green asterisks = the outcome’s variance is statistically better than expected. Red asterisks = the outcome’s variance is statistically worse than expected. Total lines do not have values for Statistical Significance.
All-Cause Hospital-Wide 30-Day Readmissions based on PRA 4.0 2023
-
Outcome Cases - The number of inpatient index admissions that qualified for risk adjustment. Based on the Outcome Case methodology, some cases may not qualify for risk adjustment.
-
Observed - The Observed value is the observed readmission rate based on the outcome cases.
-
Expected - The Expected value is the expected readmission rate, calculated using the CareScience Analytics risk-adjustment methodology.
-
Variation - The Observed value minus the Expected value.
-
O/E - The Observed value divided by the Expected value. Less than 1 = performing better than expected. Greater than 1 = performing worse than expected.
-
SS - Asterisks display only if the Variation is statistically significant. The number of asterisks indicates the confidence level that the outcome's variation is not due to chance: 1 asterisk = 75%, 2 asterisks = 95%, 3 asterisks = 99%. Green asterisks = the outcome’s variance is statistically better than expected. Red asterisks = the outcome’s variance is statistically worse than expected. Total lines do not have values for Statistical Significance.
All-Cause 30-Day Readmissions for All Inpatients
-
Outcome Cases - The number of inpatient index admissions that qualified for risk adjustment. Based on the Outcome Case methodology, some cases may not qualify for risk adjustment.
-
Observed - The Observed value is the observed readmission rate based on the outcome cases.
-
Expected - The Expected value is the expected readmission rate, calculated using the CareScience Analytics risk-adjustment methodology.
-
Variation - The Observed value minus the Expected value.
-
O/E - The Observed value divided by the Expected value. Less than 1 = performing better than expected. Greater than 1 = performing worse than expected.
-
SS - Asterisks display only if the Variation is statistically significant. The number of asterisks indicates the confidence level that the outcome's variation is not due to chance: 1 asterisk = 75%, 2 asterisks = 95%, 3 asterisks = 99%. Green asterisks = the outcome’s variance is statistically better than expected. Red asterisks = the outcome’s variance is statistically worse than expected. Total lines do not have values for Statistical Significance.
Geometric LOS:
- Outcome Cases - The number of cases for the LOS outcome that qualified for risk adjustment. Based on the Outcome Case methodology, some cases may not qualify for risk adjustment.
- Observed - The geometric mean length of stay (LOS) for the LOS Outcome Cases.
- Expected - The expected value for the Outcome Cases, calculated using the CareScience Analytics risk-adjustment methodology and the geometric mean.
- Variation - The Observed value minus the Expected value.
- O/E - The Observed value divided by the Expected value. Less than 1 = performing better than expected. Greater than 1 = performing worse than expected.
- SS - Asterisks display only if the Variation is statistically significant. The number of asterisks indicates the confidence level that the outcome's variation is not due to chance: 1 asterisk = 75%, 2 asterisks = 95%, 3 asterisks = 99%. Green asterisks = the outcome’s variance is statistically better than expected. Red asterisks = the outcome’s variance is statistically worse than expected. Total lines do not have values for Statistical Significance.
Geometric Cost/Case:
- Outcome Cases - The number of cases for the Cost/Case outcome that qualified for risk adjustment. Based on the Outcome Case methodology, some cases may not qualify for risk adjustment.
- Observed - The cost/case for the Cost Outcome Cases.
- Expected - The expected value for the Outcome Cases, calculated using the CareScience Analytics risk-adjustment methodology and the geometric mean.
- Variation - The Observed value minus the Expected value.
- O/E - The Observed value divided by the Expected value. Less than 1 = performing better than expected. Greater than 1 = performing worse than expected.
- SS - Asterisks display only if the Variation is statistically significant. The number of asterisks indicates the confidence level that the outcome's variation is not due to chance: 1 asterisk = 75%, 2 asterisks = 95%, 3 asterisks = 99%. Green asterisks = the outcome’s variance is statistically better than expected. Red asterisks = the outcome’s variance is statistically worse than expected. Total lines do not have values for Statistical Significance.
Geometric Charge/Case:
Note: Expected values for the Charge outcome are calculated only for Standard Practice. If Standard Practice is selected in the Page-By, this row no longer displays.
- Outcome Cases - The number of cases for the Charge/Case outcome that qualified for risk adjustment. Based on the Outcome Case methodology, some cases may not qualify for risk adjustment.
- Observed - The charge/case for the Charge Outcome Cases.
- Expected - The expected value for the Outcome Cases, calculated using the CareScience Analytics risk-adjustment methodology and the geometric mean.
- Variation - The Observed value minus the Expected value.
- O/E - The Observed value divided by the Expected value. Less than 1 = performing better than expected. Greater than 1 = performing worse than expected.
- SS - Asterisks display only if the Variation is statistically significant. The number of asterisks indicates the confidence level that the outcome's variation is not due to chance: 1 asterisk = 75%, 2 asterisks = 95%, 3 asterisks = 99%. Green asterisks = the outcome’s variance is statistically better than expected. Red asterisks = the outcome’s variance is statistically worse than expected. Total lines do not have values for Statistical Significance.
Arithmetic LOS:
- Outcome Cases - The number of cases for the LOS outcome that qualified for risk adjustment. Based on the Outcome Case methodology, some cases may not qualify for risk adjustment.
- Observed - The arithmetic mean length of stay LOS for the LOS Outcome Cases.
- Expected - The expected value for the Outcome Cases, calculated using the CareScience Analytics risk-adjustment methodology and the arithmetic mean.
- Variation - The Observed value minus the Expected value.
- O/E - The Observed value divided by the Expected value. Less than 1 = performing better than expected. Greater than 1 = performing worse than expected.
- SS - Asterisks display only if the Variation is statistically significant. The number of asterisks indicates the confidence level that the outcome's variation is not due to chance: 1 asterisk = 75%, 2 asterisks = 95%, 3 asterisks = 99%. Green asterisks = the outcome’s variance is statistically better than expected. Red asterisks = the outcome’s variance is statistically worse than expected. Total lines do not have values for Statistical Significance.
Arithmetic Cost/Case
- Outcome Cases - The number of cases for the Cost/Case outcome that qualified for risk adjustment. Based on the Outcome Case methodology, some cases may not qualify for risk adjustment.
- Observed - The cost/case for the Cost Outcome Cases.
- Expected - The expected value for the Outcome Cases, calculated using the CareScience Analytics risk-adjustment methodology and the arithmetic mean.
- Variation - The Observed value minus the Expected value.
- O/E - The Observed value divided by the Expected value. Less than 1 = performing better than expected. Greater than 1 = performing worse than expected.
- SS - Asterisks display only if the Variation is statistically significant. The number of asterisks indicates the confidence level that the outcome's variation is not due to chance: 1 asterisk = 75%, 2 asterisks = 95%, 3 asterisks = 99%. Green asterisks = the outcome’s variance is statistically better than expected. Red asterisks = the outcome’s variance is statistically worse than expected. Total lines do not have values for Statistical Significance.
Arithmetic Charge/Case:
Note: Expected values for the Charge outcome are calculated only for Standard Practice. If Standard Practice is selected in the Page-By, this row no longer displays.
- Outcome Cases - The number of cases for the Charge/Case outcome that qualified for risk adjustment. Based on the Outcome Case methodology, some cases may not qualify for risk adjustment.
- Observed - The charge/case for the Charge Outcome Cases.
- Expected - The expected value for the Outcome Cases, calculated using the CareScience Analytics risk-adjustment methodology and the arithmetic mean.
- Variation - The Observed value minus the Expected value.
- O/E - The Observed value divided by the Expected value. Less than 1 = performing better than expected. Greater than 1 = performing worse than expected.
- SS - Asterisks display only if the Variation is statistically significant. The number of asterisks indicates the confidence level that the outcome's variation is not due to chance: 1 asterisk = 75%, 2 asterisks = 95%, 3 asterisks = 99%. Green asterisks = the outcome’s variance is statistically better than expected. Red asterisks = the outcome’s variance is statistically worse than expected. Total lines do not have values for Statistical Significance.
For more information, see Metrics on the Risk-Adjusted Analyses.
Metrics in Report Objects
There are no additional metrics in Report Objects for this analysis.
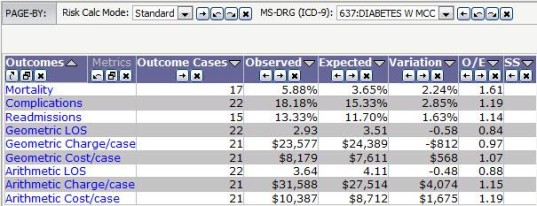
Analysis Sample
In the following sample, MS-DRG was selected for the Optional Page-By prompt on the Set Up Analyses: